Abstract
What did i do?
I've measured certain sleep metrics by using Fitbit Charge 4, Dreem 2 EEG, Oura ring 2.0, Withings Sleep Analyzer V2 and by manual assessment.
How did i do it?
For 2 months i've used all devices simultaneously and compared confidence intervals.
What did i learn?
Withings Sleep and Manual assessment seems to be a good estimates of total sleep time and a proxy to EEG device. Fitbit is less accurate compared to manual assesment and Oura shows worst results.
Introduction
Total sleep time is a measure of sleep quantity which equals to time in restorative stages - a sum of DEEP, LIGHT and REM. There are few methods and devices to measure it but which one have best agreement with EEG devices?
The purpose of this experiment (n=1) is to compare total sleep time data between finger/wristworn devices, eeg headband and by manual assessment.
Materials & Methods
Participants
Adult male anthropometrics was described in previous article.
Experimental design
From 2020-08-21 to 2021-10-23 sleep quality and quantity was assessed by Dreem 2 EEG Headband which was validated against gold standard PSG. At same time Fitbit Charge 4, Withings Sleep Analyzer V2, Oura ring 2.0 was used and sleep data was collected. There were 56-63 nights with data from all devices.
At the same time, certain sleep metrics was manually assessed every morning by a short questionnaire: bedtime start, bedtime end, sleep onset latency, wake after sleep onset. Questionnaire were filled before checking any devices and within 10 minutes after waking up. Total sleep time (TST) is calculated by formula TST = (bedtime end - bedtime start) - sleep onset latency - wake after sleep onset.
Wearables already have TST in their raw data and no calculation is needed.
Results
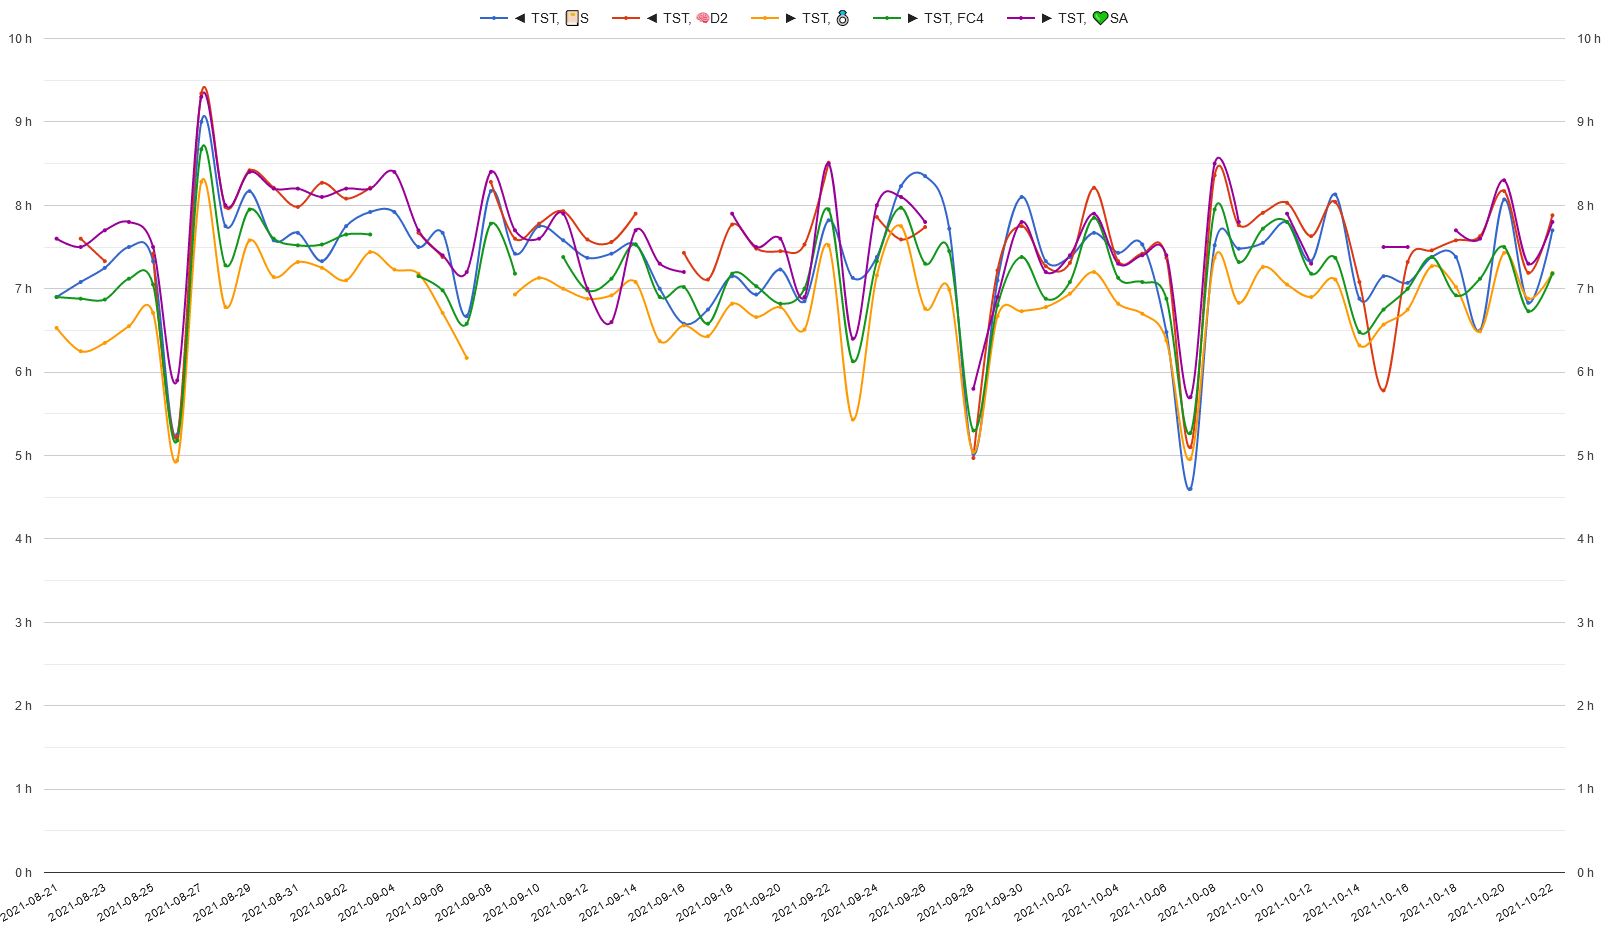
Visual inspection reveals that all sources follow general trend:

S - manual, D2 - Dreem 2, Ring - Oura, FC4 - Fitbit Charge 4, SA - Withings Sleep Analyzer
We can see that few nights were missing for some sources: Dreem 2 - 7 nights, Withings - 4, Oura - 1, Fitbit Charge - 1.
To compare total sleep time accuracy i've decided to build table with some statistical description of data.
Since Shapiro-Wilk test resulted in p < 0.05 for all sources - median, interquantile range and 95% confidence intervals (non-parametric bootstrap) were chosen for data description instead of average / standard deviations which should be used when data is normally distributed.
| Median | IQR | 95% CI | |
| Withings SA | 7.67 | [7.28,8.00] | [7.41,7.76] |
| Dreem 2 | 7.60 | [7.37,7.98] | [7.32,7.74] |
| Manual | 7.42 | [7.08,7.72] | [7.13,7.48] |
| Fitbit Charge 4 | 7.13 | [6.90,7.50] | [6.97,7.27] |
| Oura 2.0 | 6.82 | [6.56,7.16] | [6.63,6.93] |
All values in hours. IQR is 25 and 75 percentiles
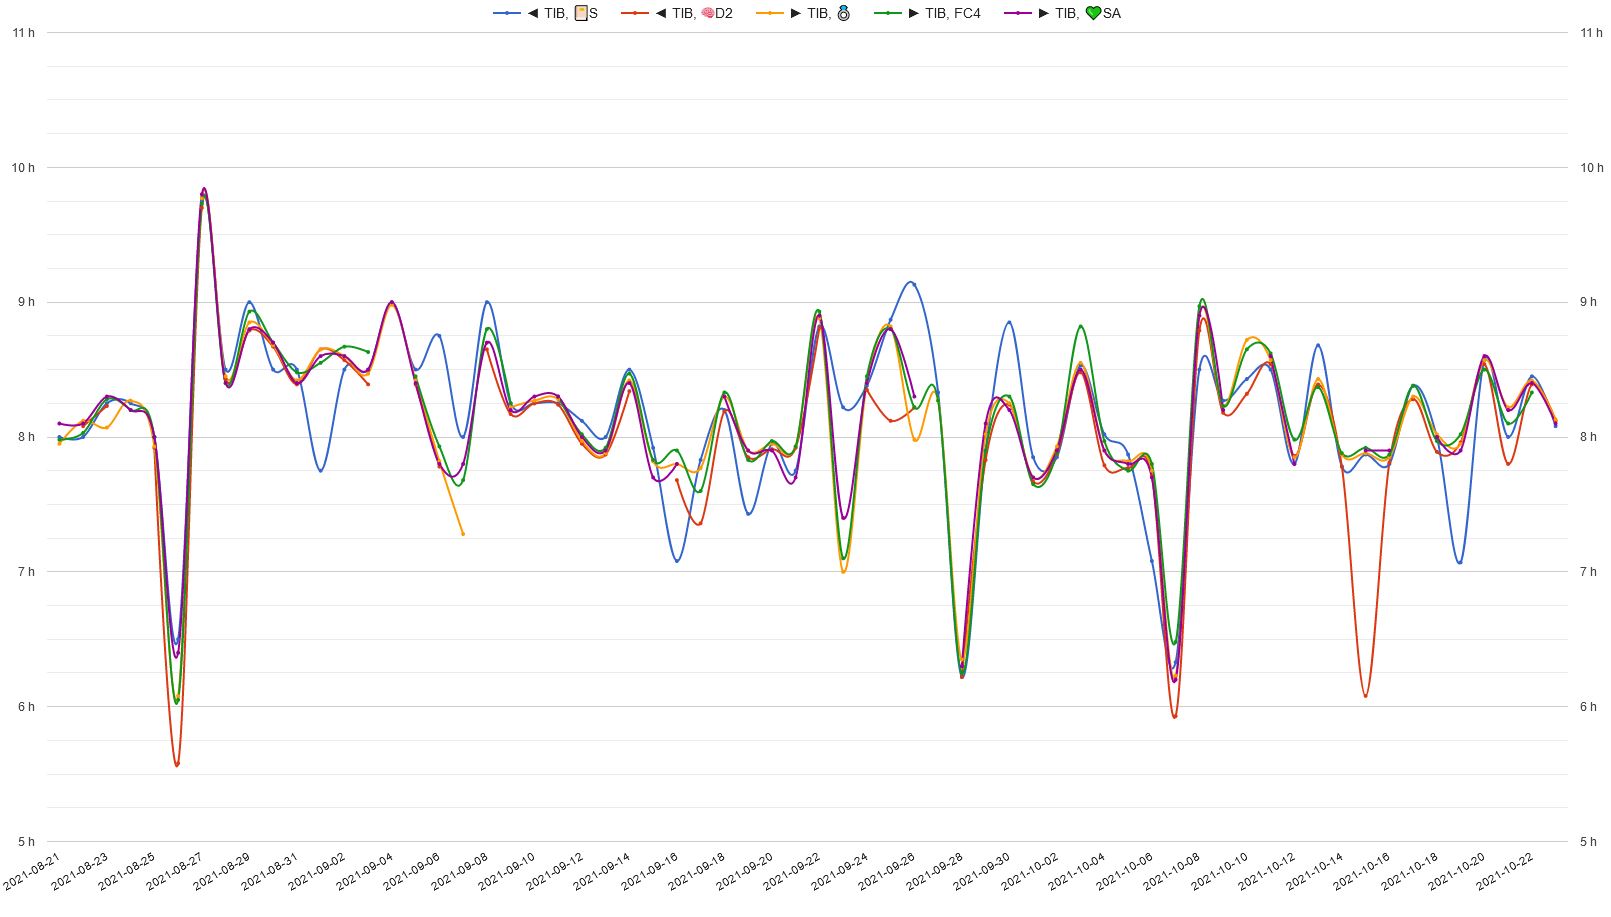
Time in bed (sum of awake time and total sleep time) reveals large agreement between all sources:

Time in bed
| Median | IQR | 95% CI | |
| Withings SA | 8.13 | [7.85,8.43] | [7.96,8.26] |
| Dreem 2 | 8.03 | [7.83,8.34] | [7.81,8.18] |
| Manual | 8.14 | [7.87,8.50] | [7.98,8.28] |
| Fitbit Charge 4 | 8.13 | [7.90,8.47] | [7.97,8.27] |
| Oura 2.0 | 8.11 | [7.88,8.43] | [7.94,8.24] |
All values in hours. IQR is 25 and 75 percentiles
Discussion
Using Dreem 2 as a reference device (EEG seems to be most accurate) for Total Sleep Time my final conclusions:
1st place: Withings Sleep Analyzer shows large overlapping with Dreem 2 95% CI.
2nd place: Manual assessment is not far from Dreem 2 and shows partial overlap.
3nd place: Fitbit Charge 4 doesnt overlap with Dreem 2 and half an hour away from median TST.
4nd place: Oura ring is far away from Dreem 2 by ~48 minutes. CI doesnt overlap with any of other sources.
Withings Sleep and Manual assessment seems to be a good estimates of total sleep time and a proxy to EEG device. Fitbit is less accurate compared to manual assesment and Oura shows worst results.
Time in bed (total sleep time + time awake) seems to be fine between all sources (only ~5 minute difference, insignificant).
It may be fine not to use any device and just fill google spreadsheet each morning with a few estimates about previous night sleep to get a good estimation of total sleep time and time in bed.
It's not a good idea to compare confidence intervals for means, the correct way is to compare CI's for difference between means, but since results are preliminary, i dont go deep too much. There were not too much missing data to bother with. I'll update post and add correlation analysis in a future, when i gather more data.
I want to be able to detect at least 10 minutes effect which is 10 / 46.2 = 0.22 of my standard deviation.
Simple power analysis suggests i need 164 nights (with 95% significance and 80% power), so it might take some time… But is it matter? I think the results wont provide addition value and it may be just enough to stop here.
A limitations:
- These results are NOT generalizable
- Observational nature, n=1
- Manual assessment accuracy may be affected by calibration with wearables and learning
Data availability & Information
Welcome for questions, suggestions and critics in comments below.
Data is available here.
Statistical analysis
RStudio version 1.3.959 and R version 4.0.2.