Abstract
What did i do?
I've measured my caffeine intake, sleep quality and quantity to find out is there a safe dose, which not disrupt my sleep.
How did i do it?
I've slept 145 nights with Dreem 2 headband and measure my daily caffeine intake.
What did i learn?
Introduction
Caffeine is a widely consumed stimulant which in most cases disrupt sleep quantity and quality.
The purpose of this observational data analysis (n=1) is to determine impact of caffeine on my sleep.
Materials & Methods
Participants
1 adult male anthropometrics was described in previous article
Experimental design
During 145 nights (from 2020-08-27 to 2021-08-21) amount of pink noise stimulations and DEEP sleep length was assessed by Dreem 2 EEG Headband which was validated[1] against gold standard PSG. At same time, all food and fluid intake was carefully logged and caffeine intake extracted from dietary log. Caffeine amount in each product was determined from a popular online food database - https://nutritiondata.self.com/
Subjective sleep quality, mood, depression, anxiety, stress, fatigue and sleepiness was assessed by a popular in scientific research questionnaires described in previous experiment
Results
Sleep metrics was described in previous article.
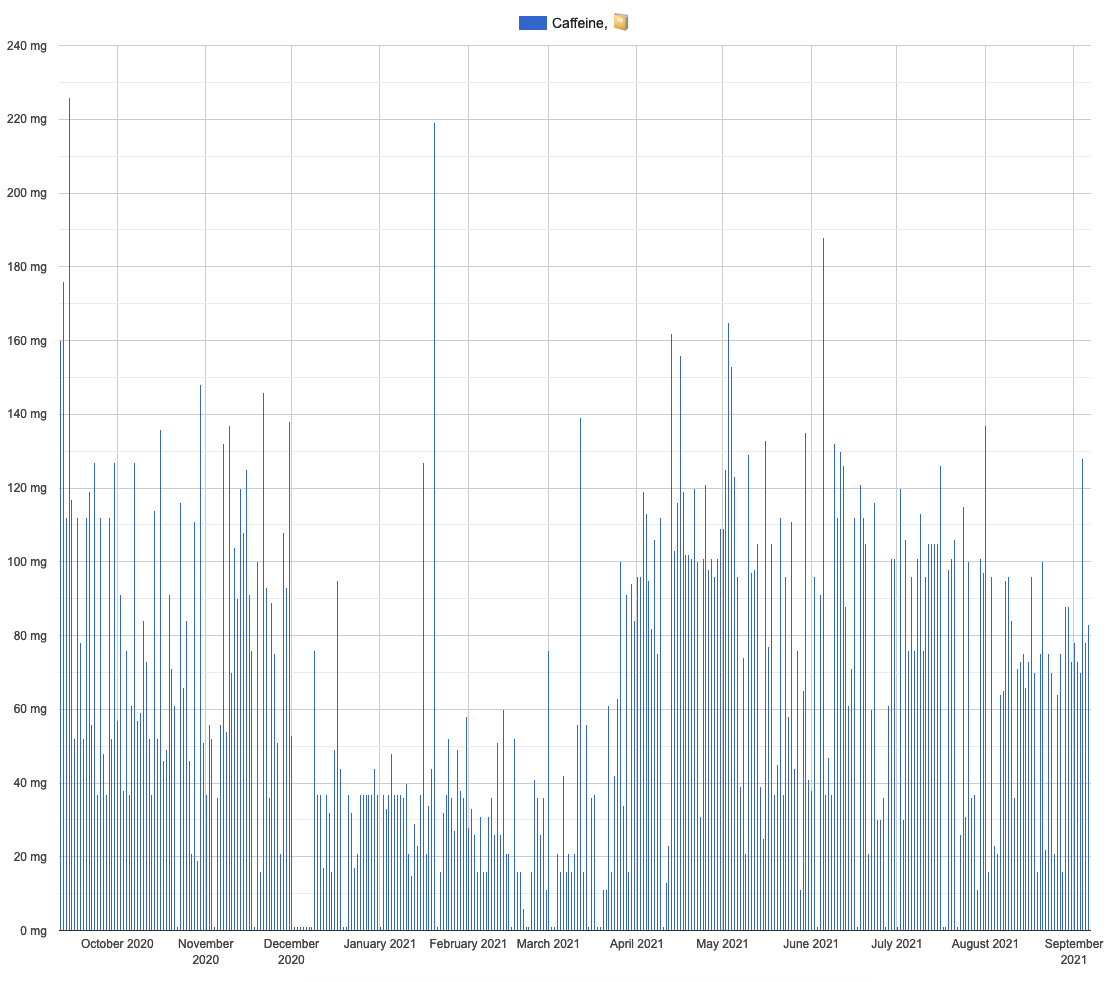
Caffeine intake visual inspection:
Linear regression, Caffeine intake, mg
| effect | p-adjusted | effect size | |
| TST, m | -0.402 | 0.00001* | moderate |
| DEEP, m | -0.104 | 0.0105* | weak |
| REM, m | -0.203 | 0.0007* | weak |
| AWAKE, m | 0.056 | 0.484 | very weak |
| Awakenings, count | -0.005 | 0.362 | very weak |
| Sleep efficacy | -0.027 | 0.01 | weak |
With my average 68mg caffeine intake per day i'll get
- -7 minutes of DEEP sleep (-0.104 * 68)
- -14 minutes of REM sleep (-0.203 * 68)
- -27 minutes of total sleep time (-0.402 * 68)
Total sleep time (TST), minutes
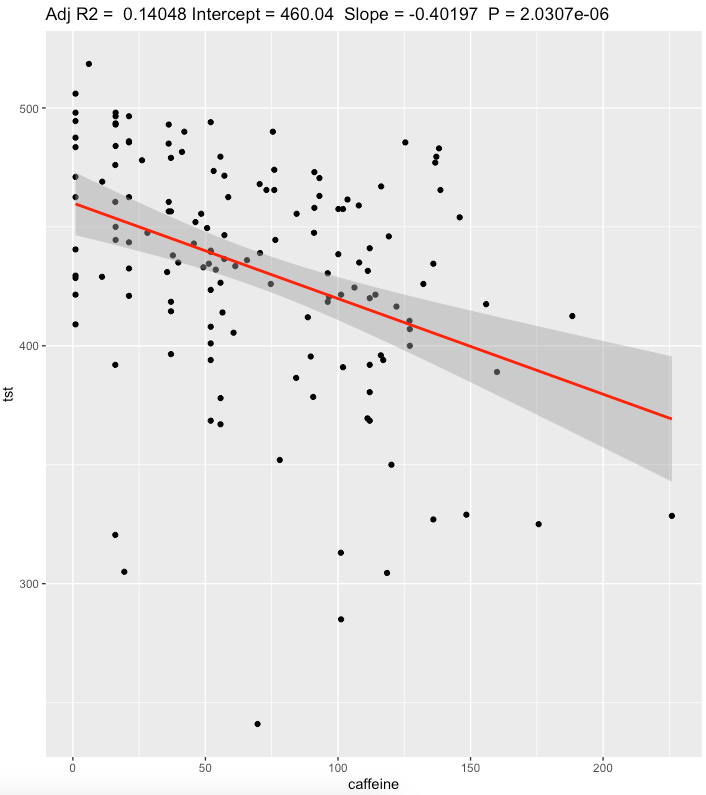
Caffeine in mg. Total Sleep Time (DEEP + REM + LIGHT) in minutes
Confidence interval for TST is pretty narrow [-0.407,-0.396] and have a moderate effect size.
Even at low doses caffeine worsens my sleep in restorative sleep phases.
But daytime of caffeine intake also matters, maybe i've consumed it in evening?
Usually my caffeine consumed between 8:30 and 11:00. Sometimes its a bit late, but most of it consumed before 13:30.
Discussion
The main result of this experiment is a statistically significant negative effect of caffeine on my sleep.
Plot points me to lower caffeine intake to 30mg and strict intake schedule to 8:30 - 10:00.
There is a few SNP's in DNA which may cause this, but that's not the case - since i've did x30 whole genome sequence and didn't found anything.
A limitations:
- These results are NOT generalizable
- Absence of blinding, randomization, observational nature, n=1
- Often correlation ≠ causation
- Questionnaires widely used in research are prone to participant bias.
- There is a lot of factors affecting sleep (diet, exercise, stress etc) which not taken into account
Data availability & Information
Welcome for questions, suggestions and critics in comments below.
Dreem 2 device unmodified data is fully available here and format is explained by manufacturer. Caffeine intake data available here.
R Code:
library(effectsize)
library(lubridate)
library(ggplot2)
ggplotRegression <- function (fit) {
require(ggplot2)
ggplot(fit$model, aes_string(x = names(fit$model)[2], y = names(fit$model)[1])) +
geom_point() +
stat_smooth(method = "lm", col = "red") +
labs(title = paste("Adj R2 = ",signif(summary(fit)$adj.r.squared, 5),
"Intercept =",signif(fit$coef[[1]],5 ),
" Slope =",signif(fit$coef[[2]], 5),
" P =",signif(summary(fit)$coef[2,4], 5)))
}
caffeine <- read.csv("https://blog.kto.to/uploads/caffeine.csv")
caffeine$`caffeine`[is.na(caffeine$`caffeine`)] <- 0;
dreem <- read.csv("https://blog.kto.to/uploads/dreem.csv", skip = 5, sep = ';', header = TRUE)
dreem <- dreem[!is.na(dreem$Type),]
row.names(dreem) <- NULL
results = vector();
for (i in 1:nrow(dreem))
{
sleepstart <- strsplit(dreem$Start.Time[i], "T")[[1]][2]
sleepstartdate <- strsplit(dreem$Start.Time[i], "T")[[1]][1]
for(j in 1:nrow(caffeine))
{
sleepstarttime <- strsplit(sleepstart, "\\+")[[1]][1]
if(as.Date(caffeine$datetime[j]) == as.Date(sleepstartdate))
{
results <- append(results, c(
starttime = period_to_seconds(hms(sleepstarttime))/60,
deep = period_to_seconds(hms(dreem$Deep.Sleep.Duration[i]))/60,
rem = period_to_seconds(hms(dreem$REM.Duration[i]))/60,
light = period_to_seconds(hms(dreem$Light.Sleep.Duration[i]))/60,
tst = (period_to_seconds(hms(dreem$Deep.Sleep.Duration[i])) + period_to_seconds(hms(dreem$REM.Duration[i])) + period_to_seconds(hms(dreem$Light.Sleep.Duration[i])))/60,
sol = period_to_seconds(hms(dreem$Sleep.Onset.Duration[i]))/60,
waso = period_to_seconds(hms(dreem$Wake.After.Sleep.Onset.Duration[i]))/60,
awakes = dreem$Number.of.awakenings[i],
awake = period_to_seconds(hms(dreem$Wake.After.Sleep.Onset.Duration[i]))/60 + period_to_seconds(hms(dreem$Wake.After.Sleep.Onset.Duration[i]))/60,
positions = dreem$Position.Changes[i],
eff = dreem$Sleep.efficiency[i],
caffeine = caffeine$caffeine[j]
))
}
}
}
res_li <- split(unname(results),names(results));
summary(res_li)
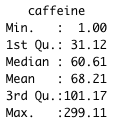
summary(caffeine)
l <- lm(cbind(deep, rem, tst, awake, awakes, eff) ~ caffeine, data=res_li)
summary(anova(l))
s <- summary(l); s
p.adjust(c(
s$`Response deep`$coefficients[,4][2],
s$`Response rem`$coefficients[,4][2],
s$`Response tst`$coefficients[,4][2],
s$`Response awake`$coefficients[,4][2],
s$`Response awakes`$coefficients[,4][2],
s$`Response eff`$coefficients[,4][2]), method="BH") #< 0.05
interpret_r2(s$`Response deep`$adj.r.squared[1], rules = "cohen1988")
interpret_r2(s$`Response rem`$adj.r.squared[1], rules = "cohen1988")
interpret_r2(s$`Response tst`$adj.r.squared[1], rules = "cohen1988")
interpret_r2(s$`Response awake`$adj.r.squared[1], rules = "cohen1988")
interpret_r2(s$`Response awakes`$adj.r.squared[1], rules = "cohen1988")
interpret_r2(s$`Response eff`$adj.r.squared[1], rules = "cohen1988")
lpa <- lm(tst ~ caffeine, data=res_li);
confint(lpa, level = 0.05)
ggplotRegression(lpa)
Response deep :

Call:
lm(formula = deep ~ caffeine, data = res_li)

Residuals:
    Min      1Q  Median      3Q     Max
-52.952 -14.231  -2.675  13.256  58.341

Coefficients:
             Estimate Std. Error t value Pr(>|t|)
(Intercept) 110.84743    3.13984  35.304  < 2e-16 ***
caffeine     -0.10375    0.03793  -2.735  0.00702 **
---
Signif. codes:  0 ‘***’ 0.001 ‘**’ 0.01 ‘*’ 0.05 ‘.’ 0.1 ‘ ’ 1

Residual standard error: 21.28 on 143 degrees of freedom
Multiple R-squared:  0.04972,    Adjusted R-squared:  0.04308
F-statistic: 7.483 on 1 and 143 DF,  p-value: 0.007019


Response rem :

Call:
lm(formula = rem ~ caffeine, data = res_li)

Residuals:
    Min      1Q  Median      3Q     Max
-76.093 -21.769   2.958  21.458  77.432

Coefficients:
             Estimate Std. Error t value Pr(>|t|)
(Intercept) 107.12047    4.46661  23.982  < 2e-16 ***
caffeine     -0.20344    0.05396  -3.771 0.000238 ***
---
Signif. codes:  0 ‘***’ 0.001 ‘**’ 0.01 ‘*’ 0.05 ‘.’ 0.1 ‘ ’ 1

Residual standard error: 30.27 on 143 degrees of freedom
Multiple R-squared:  0.09043,    Adjusted R-squared:  0.08407
F-statistic: 14.22 on 1 and 143 DF,  p-value: 0.0002377


Response tst :

Call:
lm(formula = tst ~ caffeine, data = res_li)

Residuals:
     Min       1Q   Median       3Q      Max
-191.034  -23.352    6.892   34.466   78.473

Coefficients:
             Estimate Std. Error t value Pr(>|t|)
(Intercept) 460.03973    6.71817  68.477  < 2e-16 ***
caffeine     -0.40197    0.08115  -4.953 2.03e-06 ***
---
Signif. codes:  0 ‘***’ 0.001 ‘**’ 0.01 ‘*’ 0.05 ‘.’ 0.1 ‘ ’ 1

Residual standard error: 45.53 on 143 degrees of freedom
Multiple R-squared:  0.1464,    Adjusted R-squared:  0.1405
F-statistic: 24.54 on 1 and 143 DF,  p-value: 2.031e-06


Response awake :

Call:
lm(formula = awake ~ caffeine, data = res_li)

Residuals:
   Min     1Q Median     3Q    Max
-53.57 -27.70 -16.39  11.32 212.65

Coefficients:
            Estimate Std. Error t value Pr(>|t|)
(Intercept) 51.64242    6.66267   7.751 1.55e-12 ***
caffeine     0.05643    0.08048   0.701    0.484
---
Signif. codes:  0 ‘***’ 0.001 ‘**’ 0.01 ‘*’ 0.05 ‘.’ 0.1 ‘ ’ 1

Residual standard error: 45.16 on 143 degrees of freedom
Multiple R-squared:  0.003426,    Adjusted R-squared:  -0.003543
F-statistic: 0.4915 on 1 and 143 DF,  p-value: 0.4844


Response awakes :

Call:
lm(formula = awakes ~ caffeine, data = res_li)

Residuals:
    Min      1Q  Median      3Q     Max
-4.5095 -1.6467 -0.4457  1.4251  8.7842

Coefficients:
             Estimate Std. Error t value Pr(>|t|)
(Intercept)  5.699684   0.382420  14.904   <2e-16 ***
caffeine    -0.004783   0.004619  -1.035    0.302
---
Signif. codes:  0 ‘***’ 0.001 ‘**’ 0.01 ‘*’ 0.05 ‘.’ 0.1 ‘ ’ 1

Residual standard error: 2.592 on 143 degrees of freedom
Multiple R-squared:  0.007441,    Adjusted R-squared:  0.0004997
F-statistic: 1.072 on 1 and 143 DF,  p-value: 0.3022


Response eff :

Call:
lm(formula = eff ~ caffeine, data = res_li)

Residuals:
    Min      1Q  Median      3Q     Max
-23.144  -3.054   1.746   3.583   9.172

Coefficients:
             Estimate Std. Error t value Pr(>|t|)
(Intercept) 90.583341   0.813813 111.307  < 2e-16 ***
caffeine    -0.027474   0.009831  -2.795  0.00591 **
---
Signif. codes:  0 ‘***’ 0.001 ‘**’ 0.01 ‘*’ 0.05 ‘.’ 0.1 ‘ ’ 1

Residual standard error: 5.516 on 143 degrees of freedom
Multiple R-squared:  0.05179,    Adjusted R-squared:  0.04516
F-statistic:  7.81 on 1 and 143 DF,  p-value: 0.005908
caffeine caffeine caffeine caffeine caffeine caffeine
1.052829e-02 7.130307e-04 1.218435e-05 4.843764e-01 3.626927e-01 1.052829e-02 > interpret_r2(s$`Response deep`$adj.r.squared[1], rules = "cohen1988")
[1] "weak"
(Rules: cohen1988)
> interpret_r2(s$`Response rem`$adj.r.squared[1], rules = "cohen1988")
[1] "weak"
(Rules: cohen1988)
> interpret_r2(s$`Response tst`$adj.r.squared[1], rules = "cohen1988")
[1] "moderate"
(Rules: cohen1988)
> interpret_r2(s$`Response awake`$adj.r.squared[1], rules = "cohen1988")
[1] "very weak"
(Rules: cohen1988)
> interpret_r2(s$`Response awakes`$adj.r.squared[1], rules = "cohen1988")
[1] "very weak"
(Rules: cohen1988)
> interpret_r2(s$`Response eff`$adj.r.squared[1], rules = "cohen1988")
[1] "weak"
(Rules: cohen1988)> confint(lpa, level = 0.05)
47.5 % 52.5 %
(Intercept) 459.6177100 460.4617401
caffeine -0.4070717 -0.3968761
Statistical analysis
RStudio version 1.3.959 and R version 4.0.2 was user for a simple linear regression model and to calculate slopes and p-values.
P-adjusted is p-value adjusted for multiple comparisons by method of Benjamini, Hochberg, and Yekutieli.
Effect sizes based on adjusted R2, Cohen's 1988 rules
References
- Arnal PJ, Thorey V, Debellemaniere E, et al. The Dreem Headband compared to polysomnography for EEG signal acquisition and sleep staging. Sleep 2020. https://doi.org/10.1093/sleep/zsaa097