High glucose levels is one of the main reasons of metabolic pathologies, especially in diabetes. Glucose spikes come from food consumption, especially from high-processed simple-carbohydrate rich food. Health specialists recommend to exclude food which high in GI (glyceminc index) from our diet.
These recommendations doesnt always work because every person have different glycemic responses to food and how do you know if them work especially for you? I did a personal experiment to find out how different food affect my glucose levels and expose methodology to compare different foods to make dietary decisions.
Continous glucose measuring
My current methodology:
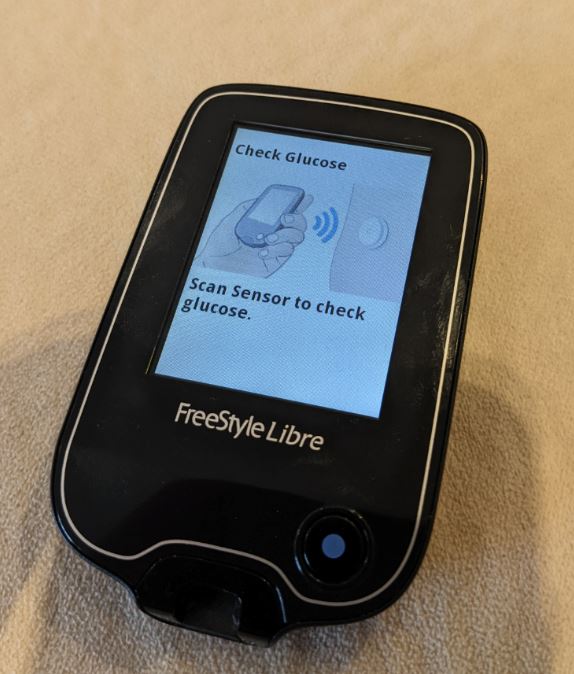
- i use CGM Freestyle Libre v1 to get glucose measurements
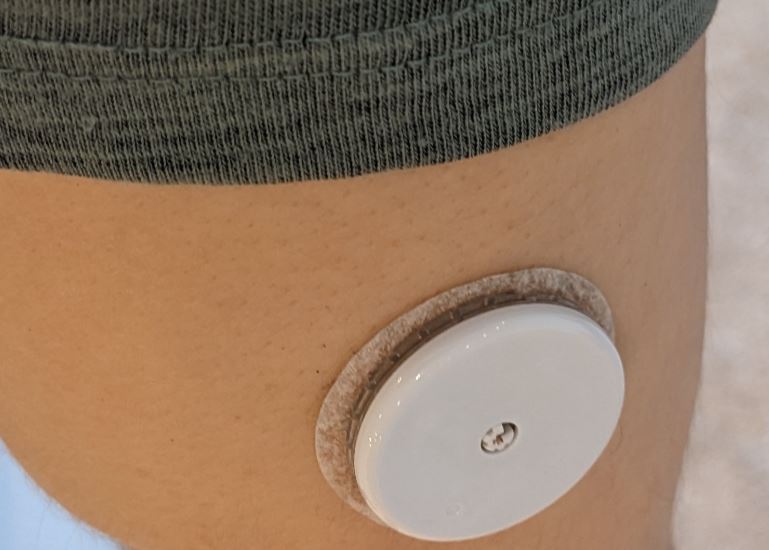
- apply the sensor, here is my usual position on the triceps
- start sensor with Freestyle Libre reader
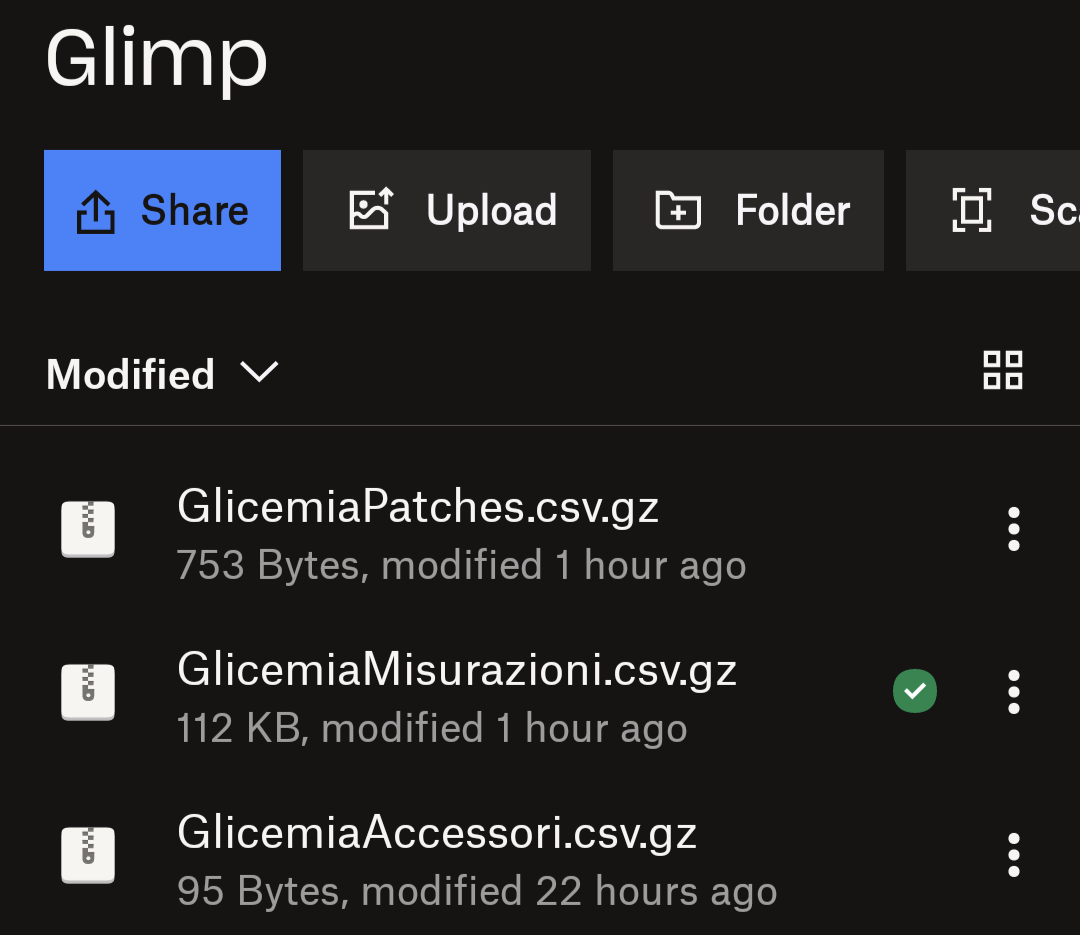
- install Glimp for Android
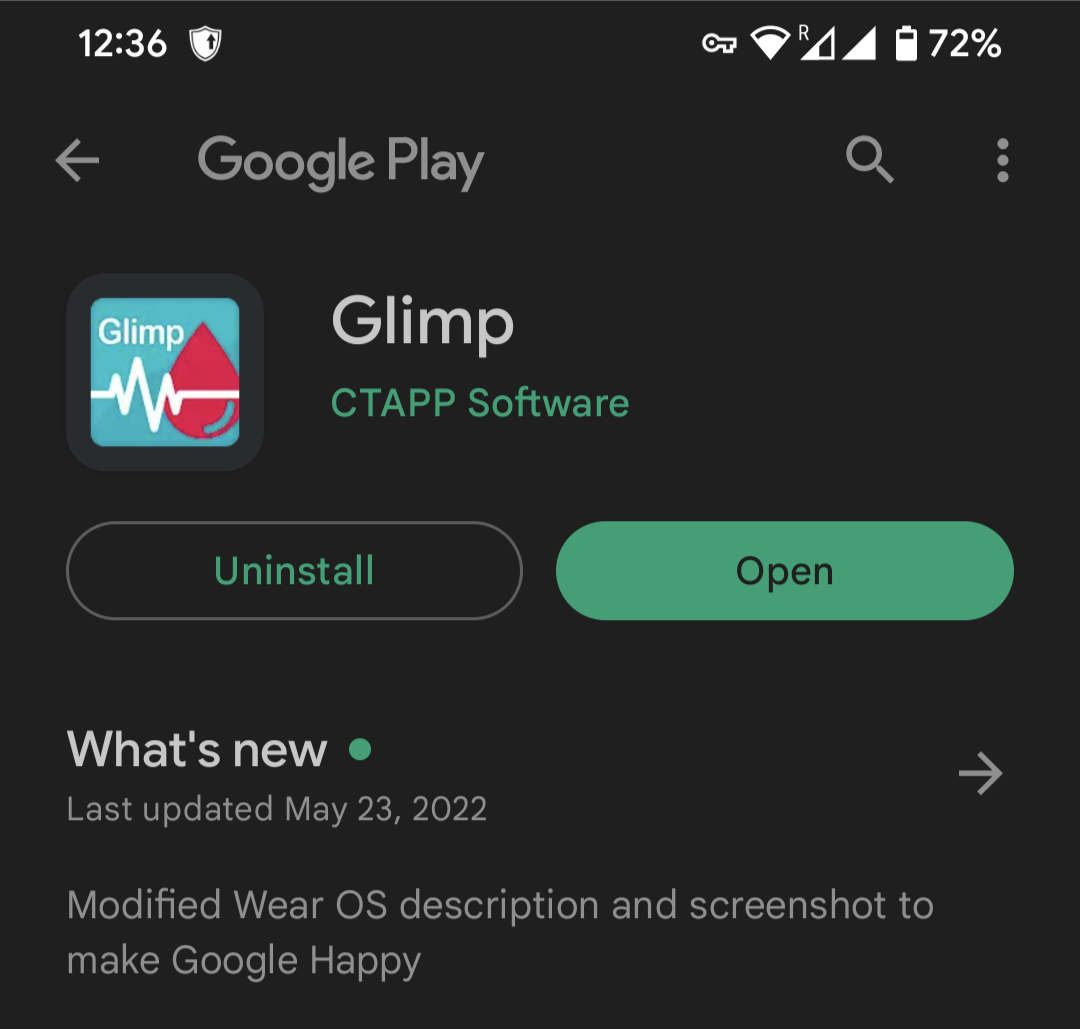
- enable "get all readings" in Settings > NFC, to get high resolution data (minute by minute)
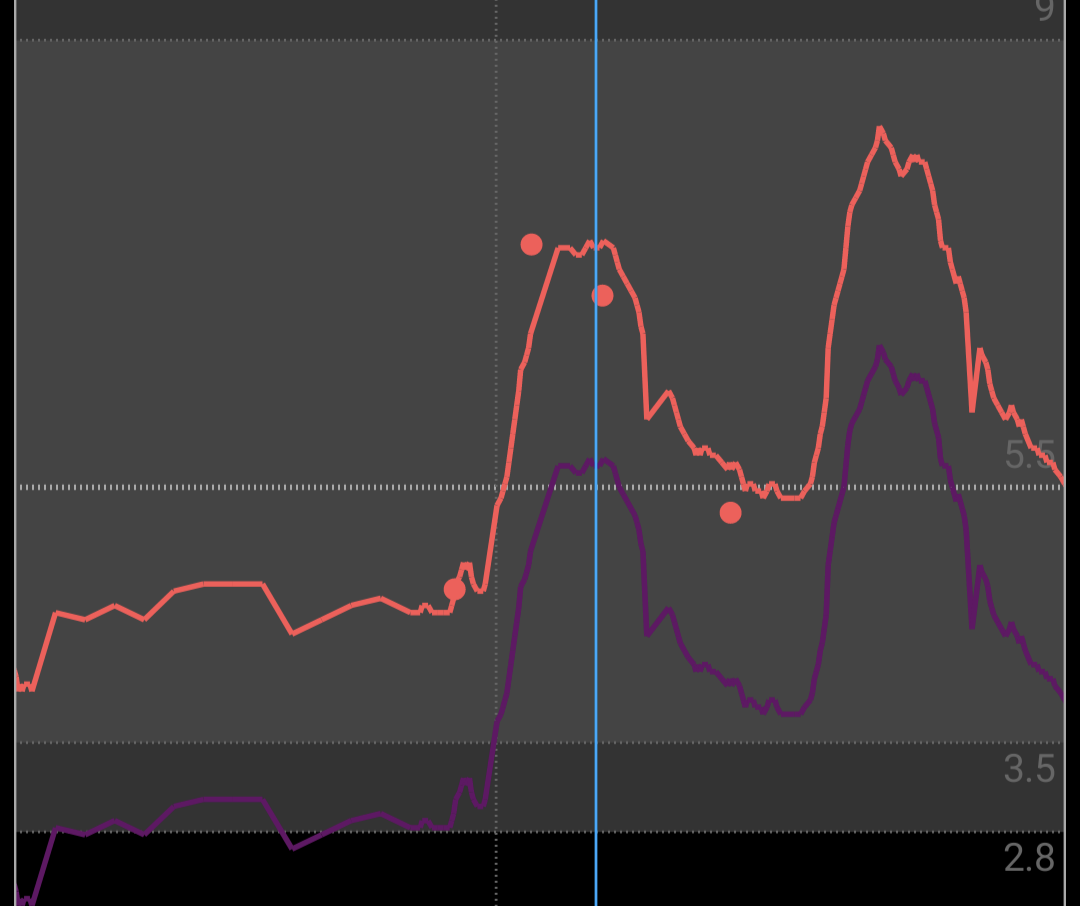
- calibrate the sensor in Glimp by adding 3+ manual measurements from fingerprick device. I use accu-check.
- purple line is raw sensor data, red points is a manual measurements and red line is calibrated measurements
- setup sync into dropbox, to extract CSV with measurements from GlicemiaMisurazioni.csv.gz
- read sensor in the morning after wake up and in the evening before sleep. I'm using both reader and phone.
- read sensor few times during the day
How to test food?
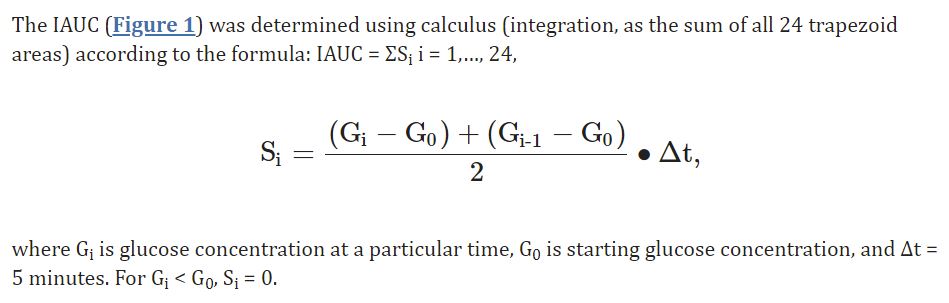
Now we want to test the food, how to do that? Here is a paper which explains how GI calculation is being performed. There is iAUC concept: we take glucose baseline before we eat certain food and then measure Area Under the Curve (AUC).
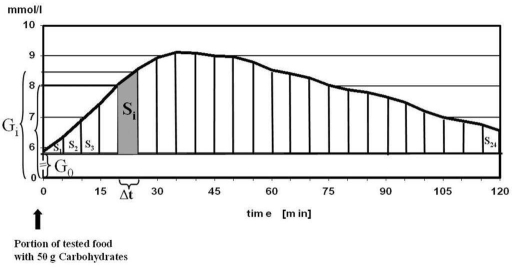
Generally speaking AUC is a time-weighed average glucose for 2 hours after we eat. First of all we generate a list of food we want to test, then we find out how much carbohydrates in that food per 100g. I often use https://nutritiondata.self.com/ or just google the food. After we know how much carbo per 100g, we should calculate portion with 50g of carbo.
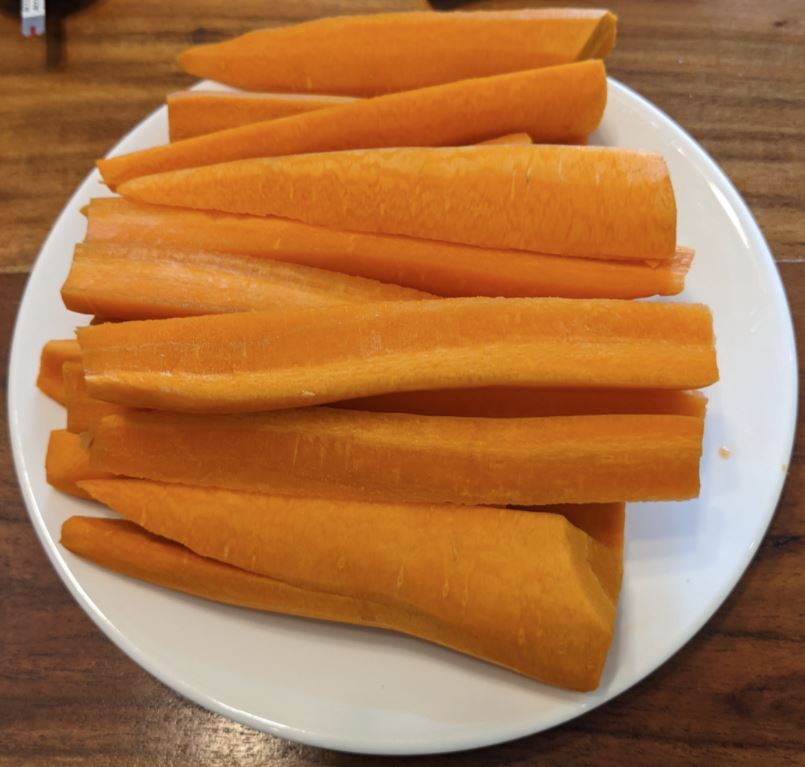
For example, today i've tested carrots. Carrots have 9.6g carbo per 100g, which means i should eat 50*100/9.6 = 520g of carrots. Here is mine :) It took 35 minutes for me to eat half kilo. Rice test was a lot easier (20g carbo per 100g, 250g portion).
After the test i dont eat anything for 2 hours and spend this time in a rest.I make my tests in the morning with single isolated product. Sometimes i make 2 tests per days, with 2h+ pause between then and make sure glucose returned to resting values before next test.
For carrots i see a glucose raise in the Glimp and next step is to calculate iAUC. I export Glimp data into CSV and run my R script (provided below) which calculates iAUC and visualize data.
Here is what i've gotten for carrots.
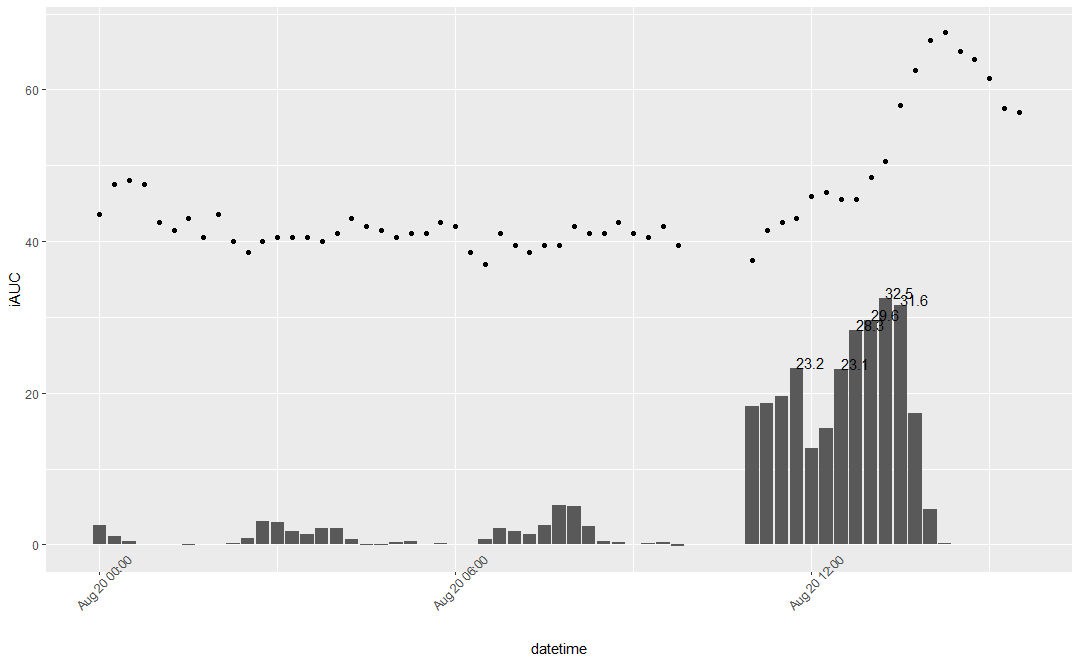
Dots represents average glucose trends. Bars represents max iAUC in mg/dl for each period
Here we can see that my iAUC for carrots is 32.5 mg/dl or 1.8 mmol/L. iAUC formula based on relative glucose values which overcomes sensors systemic bias (too low or too high absolute values, but accurate trends), so generally speaking iAUC represents relative change in glucose levels.
Here is exact formula:
Is 1.8 mmol/L a high one? To answer that question we can compare foods from personal tests, here is my list.
| mmol/L | Product |
| 5.46 | grape |
| 4.67 | beetroot |
| 4.08 | boil pumpkin |
| 3.28 | potato |
| 3.06 | rice |
| 2.83 | wholegrain pasta |
| 2.81 | banana |
| 2.78 | pomegranate |
| 2.58 | mango |
| 2.53 | millet porridge |
| 2.52 | white bread |
| 2.35 | buckwheat porridge |
| 2.3 | barley porridge |
| 2.19 | sweet potato |
| 2.16 | watermelon |
| 2.01 | tomato |
| 1.62 | peach |
| 1.57 | quinoa |
| 1.37 | apple |
| 1.02 | rice noodle |
| 0.89 | kefir* |
| 0.87 | wholegrain bread |
| 0.67 | baked pistachio |
| 0.64 | oat porridge |
| 0.62 | oat porridge whole |
| 0.54 | dark chocolate 100%* |
| 0.51 | pistachio |
| 0.19 | persimmon |
| 0.11 | carob powder |
| 0.1 | pear |
Here is my iAUC's for different foods in mmol/L per 50g of carbo. Products with "*" have values per 15g of carbo (due to hardness to eat 50g carbo portion). Carrots place is somewhere between peach and tomato. It took about 2 months of wearing CGM (spent 5 sensors) to build this list without rush (i did one period every 2-3 months).
To produce GI we need to measure how much iAUC is for pure glucose and calculate rate = product iAUC / glucose iAUC.
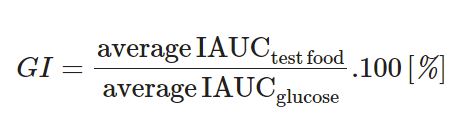
If we just want to compare different foods and predict glucose levels spike, we can just use iAUC as is. So we need our CGM data and a simple list of dates with food we have tested, for example in google spreadsheets.
If i cannot eat portion of 50g carbo then i go down to 15g portion and test it. Also sometimes there is 45g of carbo in my portions, that means i will multiply result by 50/45 = 1.11. But if i've tested only 10g of product, i do not multiply it by 50/10=5 because there are no guarantee for strict linear relationship between glucose levels and amount of carbo.
Diet decisions
Having list of foods and their glycemic responses i can make dietary decisions:
- exclude some foods with pretty high response, like grapes and beetroots
- eat without limitations foods with low glycemic response
- limit food from the middle / upper middle of list
By knowing how much different products influence glucose levels we can decide how much to eat. I know that 50g of mango carbo's (300g mango portion) increase my glucose (iAUC) by 2.58 mmol/L and by knowing that i can decide to eat half portion (150-200g) and be confident that my glucose will stay in range. We can see that 50g carbo from tomatoes is slightly above 2 mmol/L, but there is 5g of carbo per 100g of tomato. So eating even half kilo of tomatoes would not spike my glucose and it's safe to eat them.
Also we should take into account that
- complex mixed meals may not be a sum of seprated test responses
- there is limited evidence that protein and fat may slow glucose uptake
- protein may increase glucose a bit by itself, because some glucose can be made from glucogenic amino acids
- circadian rhytms affect glucose uptake. In the morning we metabolise glucose better than before sleep
- exercise and training affect glucemic responses
- sleep quality and sickness affect glucemic responses
- glycemic resonses may change over time
- boiled carrot and fresh carrot are two different products and both needs to be tested
- multiple tests for single product are prefered, to exclude random deviations
- this approach is still rough, but better than relying just on GI from google
- there are some data that microbiome may predict glycemic responses and we can pass on hardcore testing each product one by one
- if you want know more, i can recommend reading book Personalized Diet
Anything else?
There is interesting paper "Glucotypes reveal new patterns of glucose dysregulation" about glucotypes where scientists clustered people by their glucemic response variations into 3 types: low, moderate and severe.
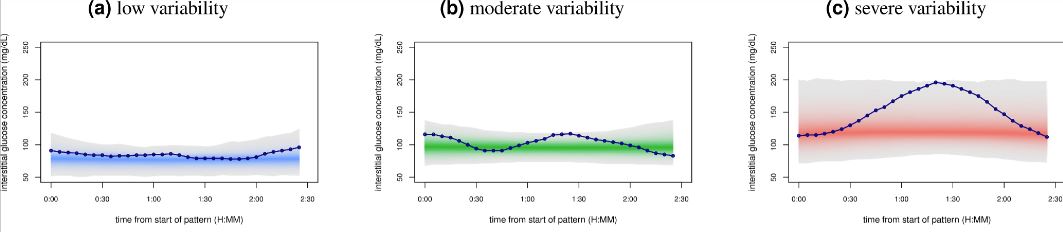
This approach seems to be pretty interesting, huge part of people from severe group and significant part of moderate group developed type 2 diabetes (T2D) in the long run, but most part of low variability group didnt develop T2D. That points me that it may be worth to aim for low variability group.
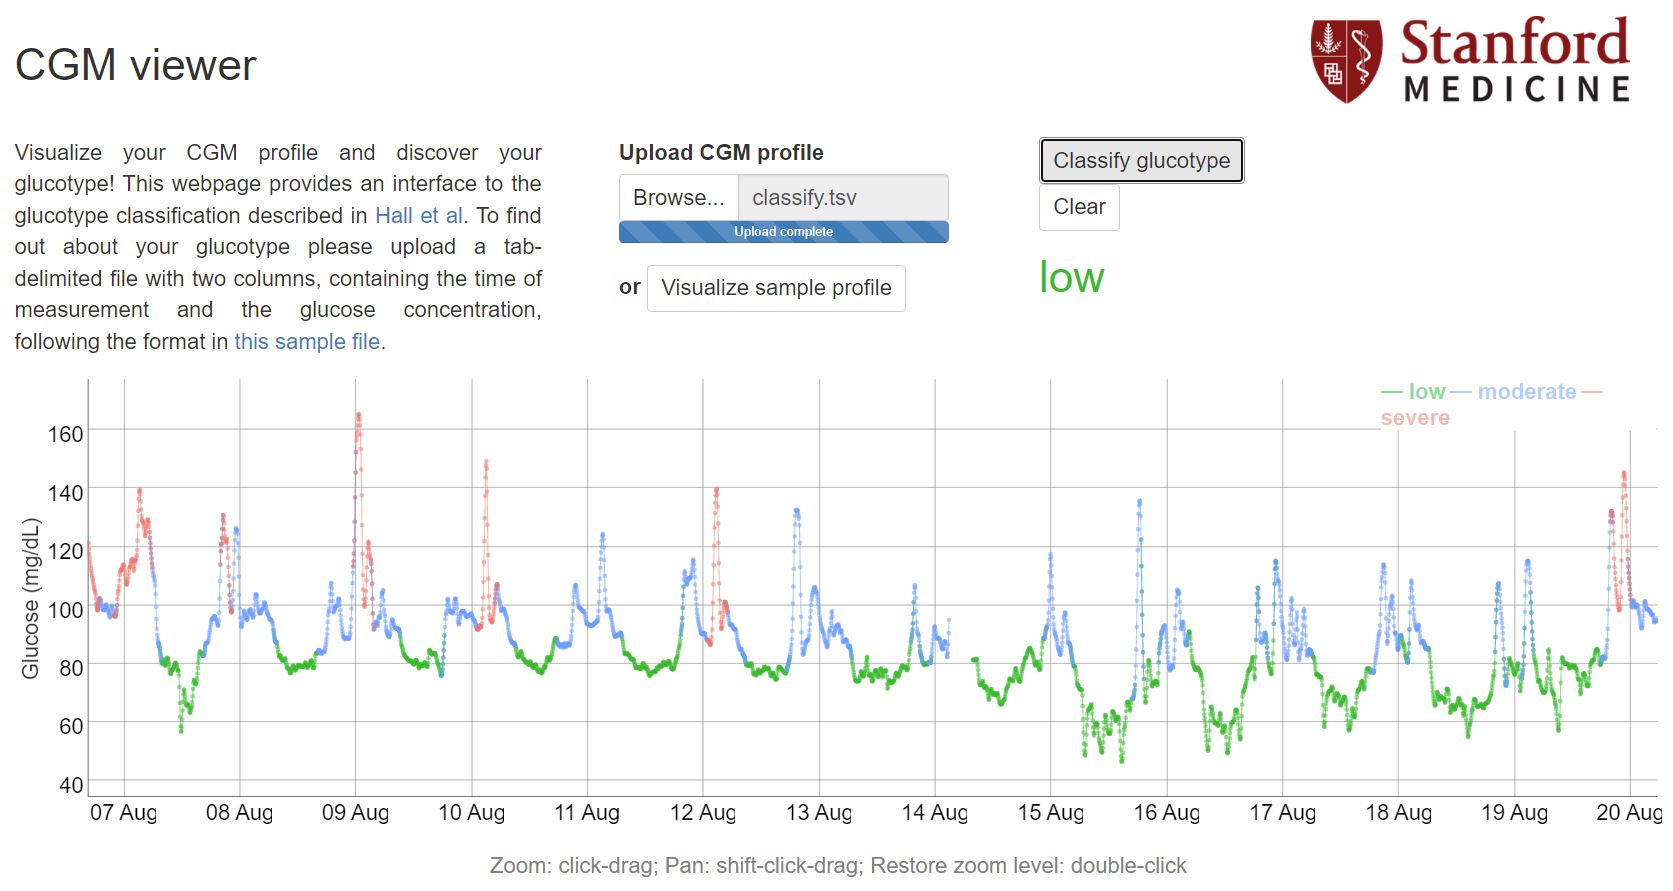
Scientists made R Code for clustering available on github and provide a webtool for easy glucotyping. Data needs to be formatted into .tsv (tab separated) file with date and glucose values (every 5 minutes) and looking like this:
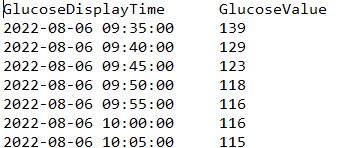
My R script generates that file in script folder and names it "classify.tsv". Alternative ways is playing with google sheets.
The webtool gives me low glucotype. This period includes some tests which reveal spiking food and i'm not going to eat it anymore (for example rice test at 9 Aug). And even with these spikes i've gotten low glucotype. So it seems my glucose metabolism is fine and my T2D risk is pretty low. On my first period with CGM i got moderate glucotype, then after some foods tests and diet adjusting my results are always stay in a low group.
Data availability & Information
Welcome for questions, suggestions and critics in comments below.
Original unmodified (exported) Glimp raw data is here.
R Code is available on Github:
Statistical analysis
RStudio version 2022.07.1 and R version 4.2.1.