HRV seems to be an important marker of stress and general health. For someone who wants to understand it better i would recommend watching Labfront's series about HRV #1, #2, #3.
Here i'm developing a QS framework to measure HRV 24/7 from raw data collection to data analysis. It will follow all recommendations [2a-b,3a-d,4a-b] from this HRV guideline for scientific studies:
Devices
Setup for measuring and utilizing HRV 24/7 should be
- Comfortable
- Provide high quality raw data in different situations (sleep, rest, exercise)
- Minimise requirements for long term data collection in living conditions, have good battery life
- Take not too much time to apply and process
Polar H10 and Movesense MD which i use for morning standing HRV test and exercises arent comfortable for long term use (1), work in streaming mode which requires phone to be constantly near device (3) which sometimes hangs and leads to gaps in raw data (2). Another problem of H10 that it gives only RR intervals or low resolution ECG (130Hz), so we forced to use H10 peak detection algorithm which is good but is blackbox or to deal with raw ECG but we shouldn't expect good HRV. Movesense MD allows recording of ECG at 512Hz but still not usable in 24/7 due to (1) and (3).
I've tried to work with PPG raw data from Hypnodyne ZMax, Polar Verity Sense, Shimmer GSR+ and it doesnt do well in exercise / walk conditions and have some limitations:
- ZMax usable for sleep only and even in stationary sleep PPG sometimes have artifacts. RR intervals seems to be good enough for most HRV metrics (i get around r=.9 correlation for 5-minute RMSSD / r=.8 for 1-minute RMSSD vs ECG device) but some of nights HRV too high and comparable to ECG.
- Polar Verity Sense is more comfortable than H10 but RR data quality is poor and not comparable to ECG
- Shimmer GSR+ is too big to wear on wrist 24/7 and i was also not able to get good RR by trying different processing pipelines.
So these 3 devices doesnt pass data quality requirements. What else do i have?
- Oura ring v2 & v3 - records at night and limited time during day with no RR raw data
- Fitbit Charge 4/5/6 - records all day long, but no RR raw data
- Polar Vantage V2, Garmin Descent Mk2 - wrist HR is of average quality and i do not expect good RR even if they were available
So, for continuous long term HRV wristworn PPG devices doesnt look good enough and something else should be used. In the past i bought Shimmer Ebio ($600) [2a] with aim to collect respiration rate during cycling tests and recently i've realized that it can be used for this. Also it was used as reference device for Oura ring validation study.
- It can collect high quality raw ECG data even during activity with sampling frequency 512Hz (or more if needed). Additionally there are accelerometer, gyroscope, magnetometer, environment temperature and air pressure.
- Battery life is 16 hours+, so with 2 devices there will be no major gaps in data. One device can be used for evening and sleep (~10 hours) and second for day activities (~14 hours). Devices easily swapped in the morning and evening, taking less than minute (snap electrodes). In case of use of single device there will be gaps for about 1-2 hours in morning and 1.5-2.5 hours in the evening because device needs some time to charge. I've started with single one and after 2 weeks when i realise that it is good enough for this task - i've bought another one to collect data 24/7 [2b]
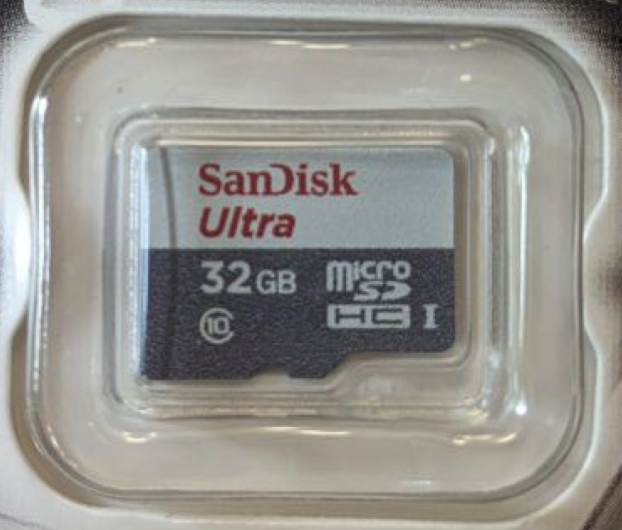
- Device can stream and write data to SD (preferred). I've inserted Sandisk Ultra 32GB class 10 microSD [2a] which can store more than 3 weeks of data with sampling frequency of 512Hz [2b]. In that setup im getting no more than 0.3% of samples are lost [3c]. 64 / 128GB cards didnt work.
- There are dock station companion which connects to PC, charges device and enables access to SD simultaneosly
- Free version of Consesys Software is available for Windows and can be used to configure and read data from device in GUI style. If someone wants automate there are open-source python API for reading device raw data.
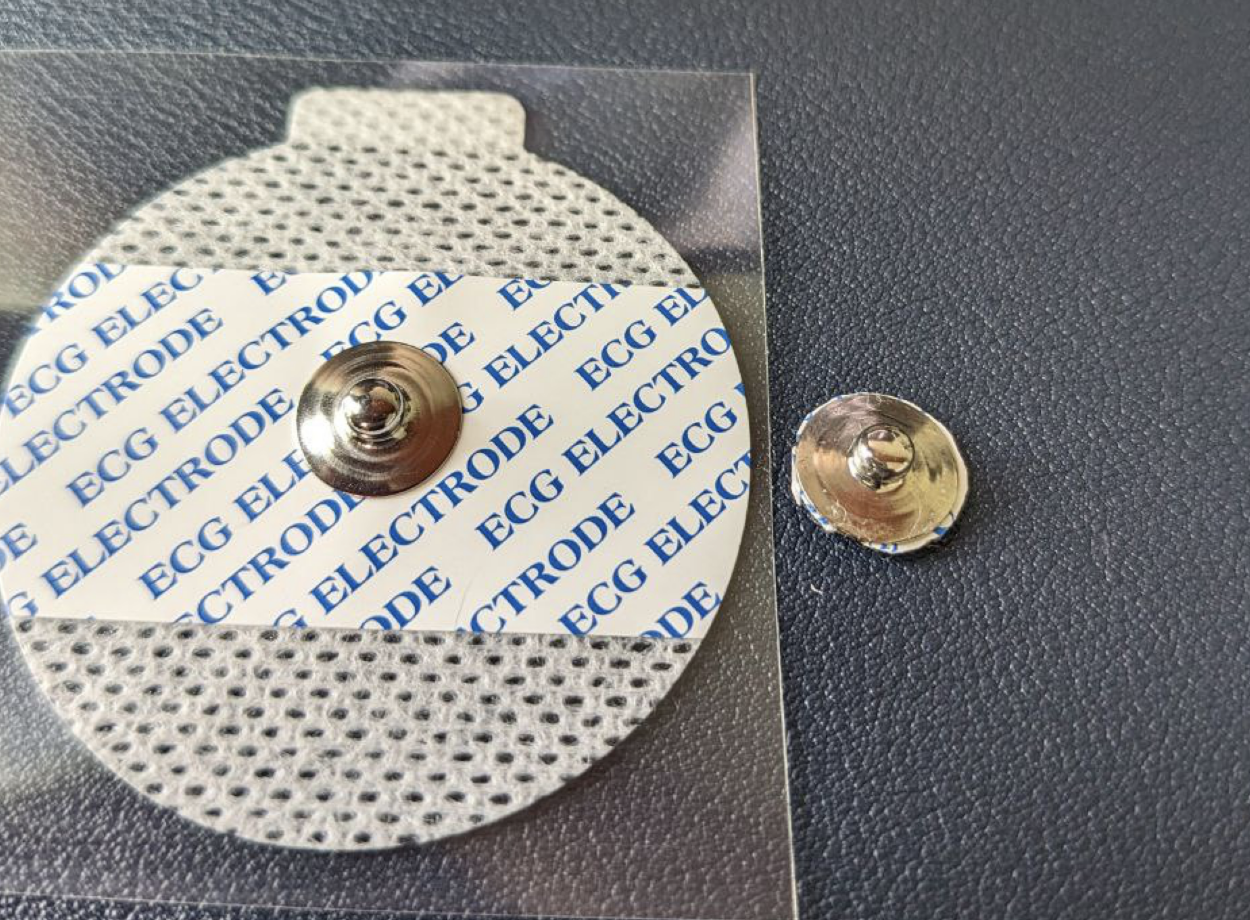
Lets talk about how to apply electrodes and how is it comfortable. Ag/AgCl electrodes [2a] are gold standard which is used for routine medical ECG. Usually their sticker part is a lot bigger than needed and gel which improves/stabilizes signal acquisition doesnt last long. Their time to apply is very fast and simple - you just stick them on place and connect snap electrodes, usually less than 1 minute is needed to apply.
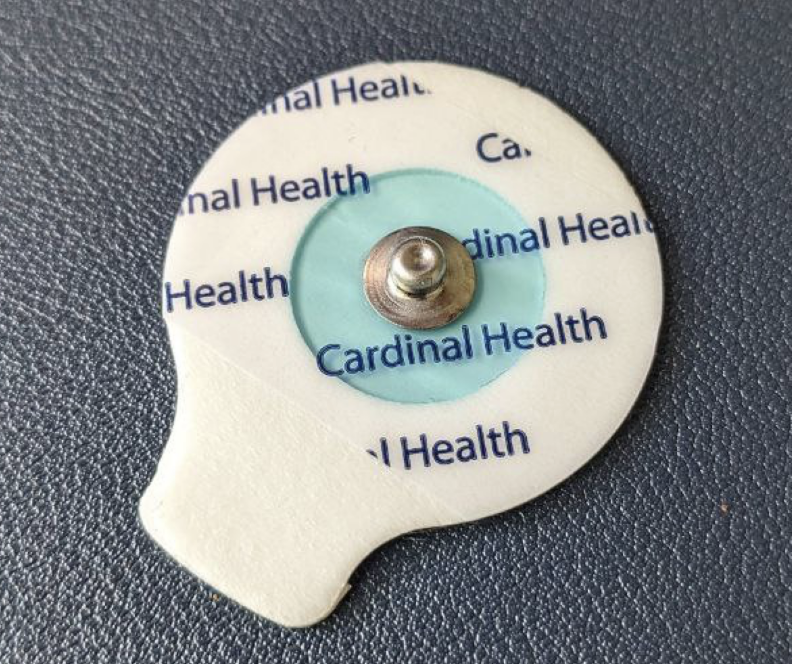
They work well for sleep / rest data, but for some reason i wasnt able to get good data during exercise (running / squats). Also I dont like big sticker and default gel doesnt do well in long term, so i've decided to modify them:
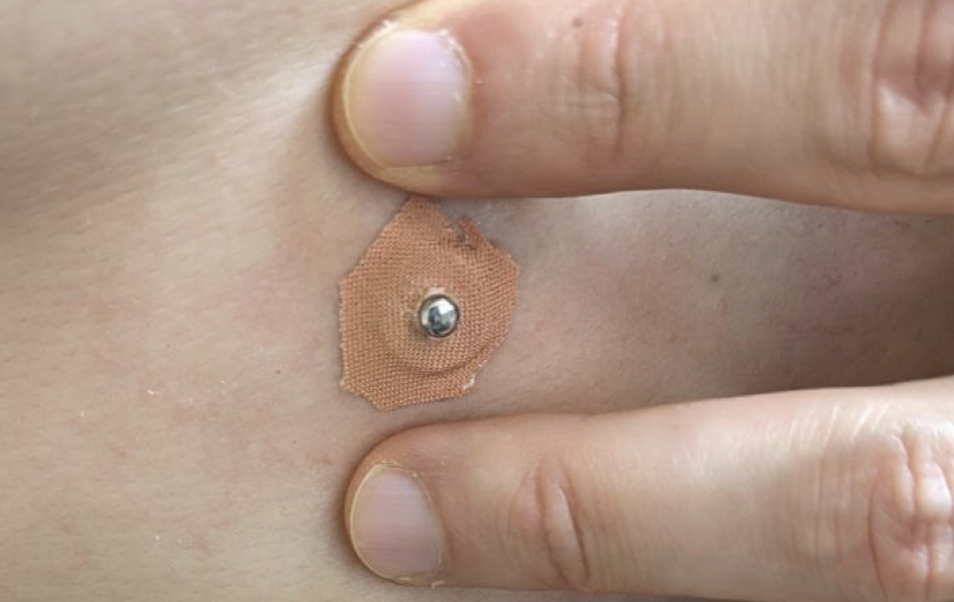
- Firstly, i cut out the metal electrode part from sticker and remove gel by sliding it with my finger. Metal electrode will last more than week (usually i change them every 2 weeks). Pack of 50 costs around $10.
- I've tried different tapes to find out one which not irritates my skin in long term use. With this one even after 2 days my skin doesnt affected at all.
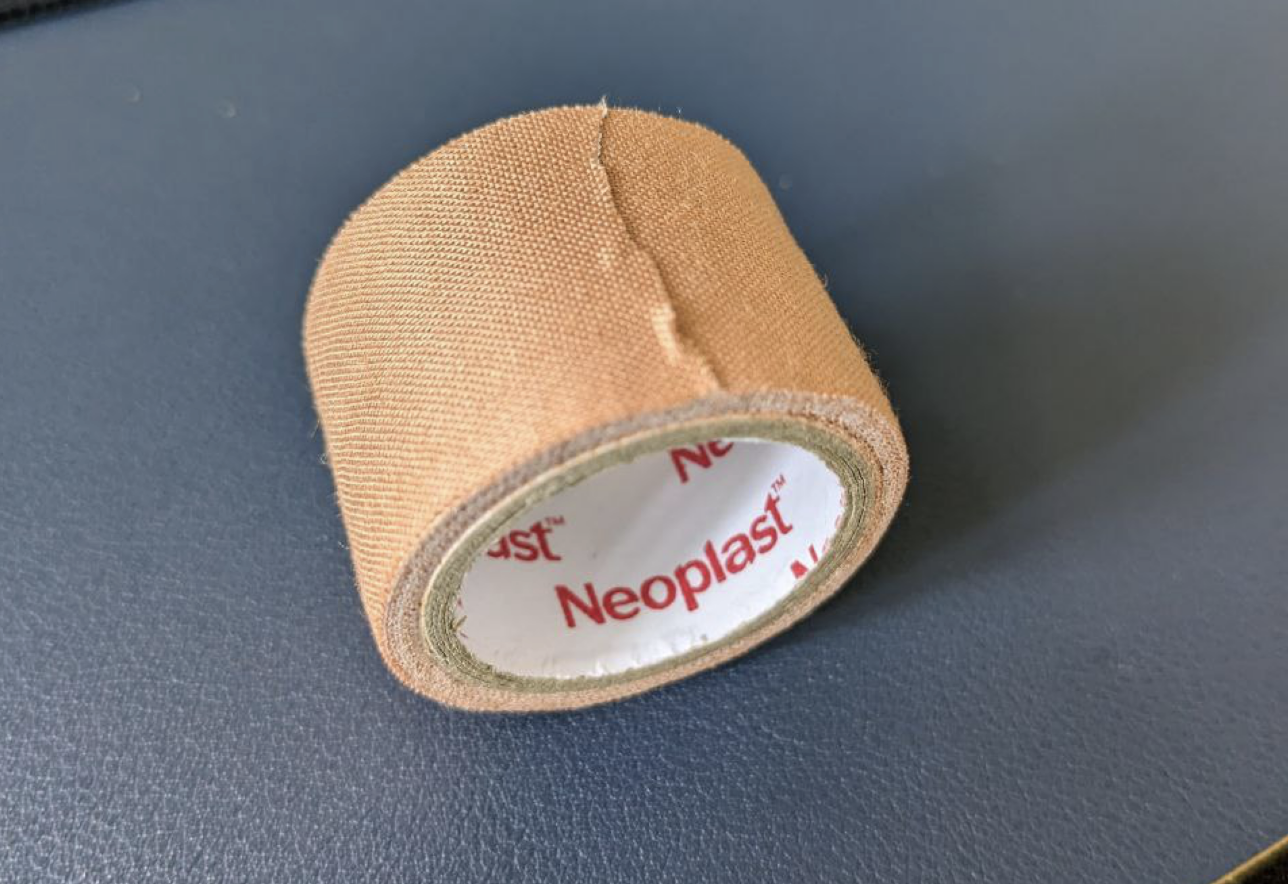
- I form a tape squad and make hole in the center, then apply Tensive Conductive Electrode Gel to the electrode and stick it to skin.
- Finally i cover electrode with tape squad
- UPDATE: i switched to silicone tape (no glue at all) and re-usable snap electrodes. Using them for 3 weeks, no irritation at all, but they a bit less stable.
- Now snap electrodes can be connected and i have good quality recording with more than 2 days without re-apply electrodes and absence of skin irritation. Actually after taking out electrodes and washing - skin will be a little red because of force applied to remove residue, but disappears after 10-20 minutes.
- Full process takes around 5 minutes and needs to be done every 1-2 days.
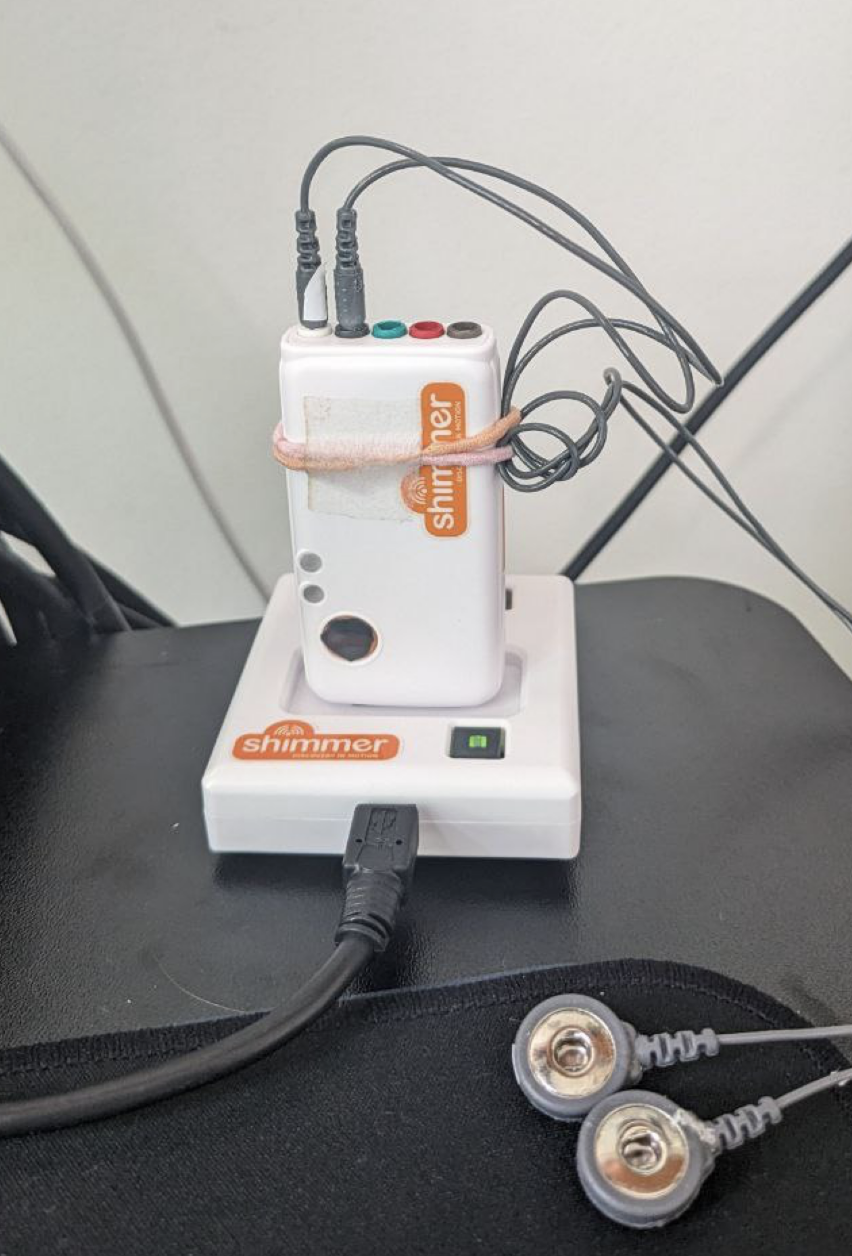
- I've made a small belt to wear device on it, because default one irritated my skin. This one (which i cut from waist bag) doesnt irritates me and i dont feel that i'm wearing anything at all. Shirt is hiding it and no one can see that i'm wearing it
- After electrodes applied in that way - its easy to connect or swap devices, less than 1 minute actually.
- I place electrodes around A-I positions [2a] with shift to middle (like middle between I - E and E - A) because its more comfortable (dont feel anything when sleep on side which is a problem at actual I and A positions) and R peak is good according to this study.
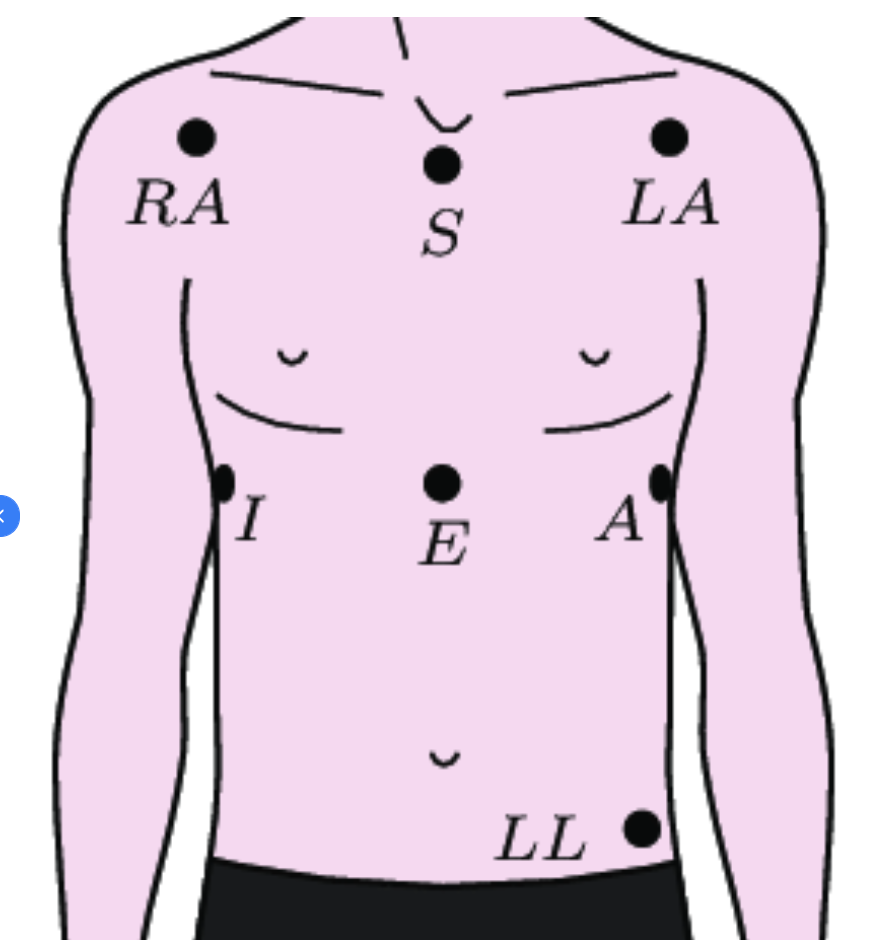
- I-E-A line also is under chest muscles and electrodes are better protected for occasional pressure and arent seen when wearing shirt.
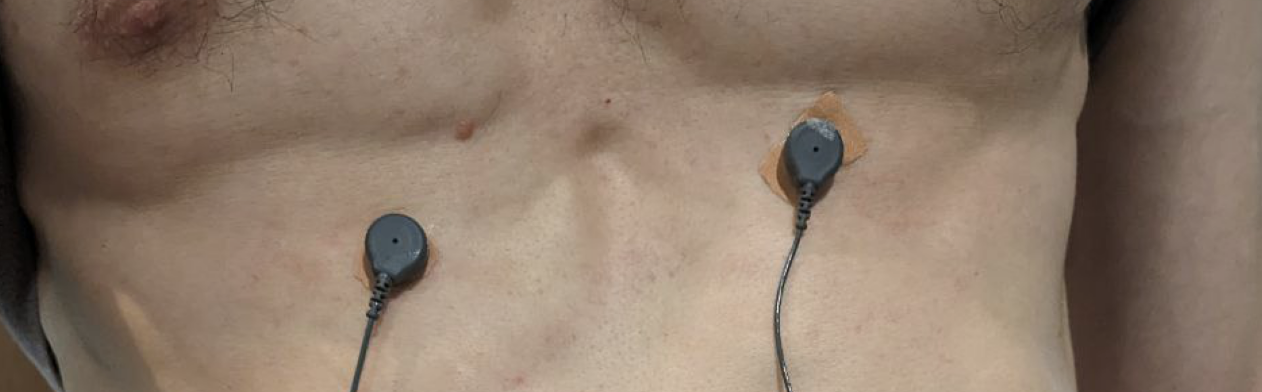
I've used this setup for a month and it seems very comfortable - i dont actually feel electrodes and live my life without feeling that i'm wearing anything 99% of time (chest movements may cause strain on electrodes cords and that can be felt, but happens very rarely and doesnt disturb too much). Sometimes i need to take off device, mostly when i need to shower or swimming in pool / beach, when i'm diving / freediving and when i'm using sauna outside of home. Most of time (like 9 out of 10) showering doesnt require to re-apply electrodes, they are fine after short term contact with water.
In a total, i spend around 5 minutes per day, not every day to re-apply electrodes and less than 1-2 minutes to swap devices in a morning, evening and before/after shower. Wearing device is pretty comfortable, not irritating my skin and i get high quality raw ECG data covering 95% and more of 24/7. I've also tried silicone tape with no glue at all and it works well enough for general activity, but perform a bit worse in a sweating conditions compared to medical tape.
I've covered 2nd chapter of HRV guideline:
- 2a Brand and electrode configuration (if applicable)
- 2b Raw sampling rate, length of data collection, time of day, filtering, participant posture and instructions
1st chapter is about participant selection which is not applicable in my case.
Data
When i switch devices i put them on companion shimmer dock which:
- Charges device
- Allows access over USB to SD card for data collection
After i put device into the dock (which connected to my macbook) - raw data from 24-bit ADC (Analog to Digital Converter) chip ADS1292R being taken out from device, backed up and processed (full automation):
- Python script monitors for Shimmer appearance on USB interface
- When device is found script copies session to backup folder and then uses pyshimmer-api to read raw data
- After reading raw data script syncs device internal clock with macbook clock, unmounts usb left device charging. In the evening / morning i take device out from dock and put another one and all process repeats automatically
Raw data requires advanced preprocessing pipeline which is fully automated with python:
- Interpolate missing samples (usually less than 0.03% of data) from raw ADC values. I'm using scipy PchipInterpolator [3a] because it have pretty good performance in preserving original shape of signal, you can read more here. Since there are pretty small amount of skipped samples one may ignore them and i dont think the data will change in any way.
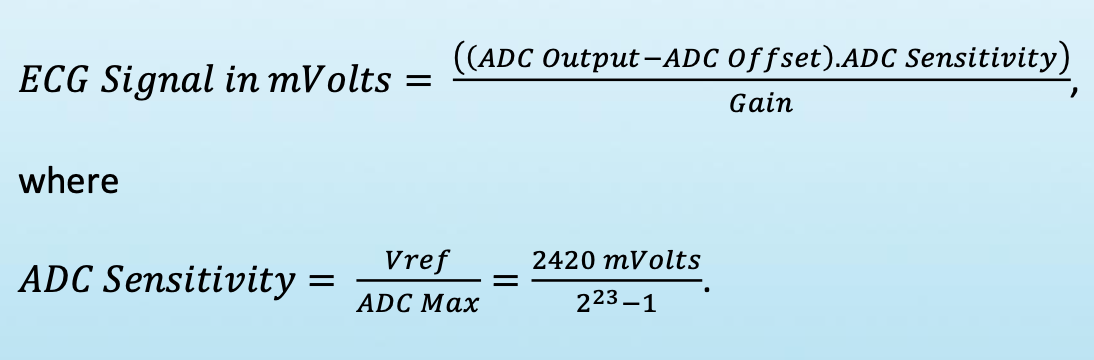
- After interpolation, which fills missings samples, the 24-bit ADC outbut values converted to mVolts (ECG signal) by using simple formula from Shimmer FAQ (Gain is set to 4; ADC.Offset is 0; ADC.Sensitivity is a constant 2420/(2^23-1))
- ECG mVolts data are written into zipped CSV and BDF (24-bit version of EDF) files for future processing
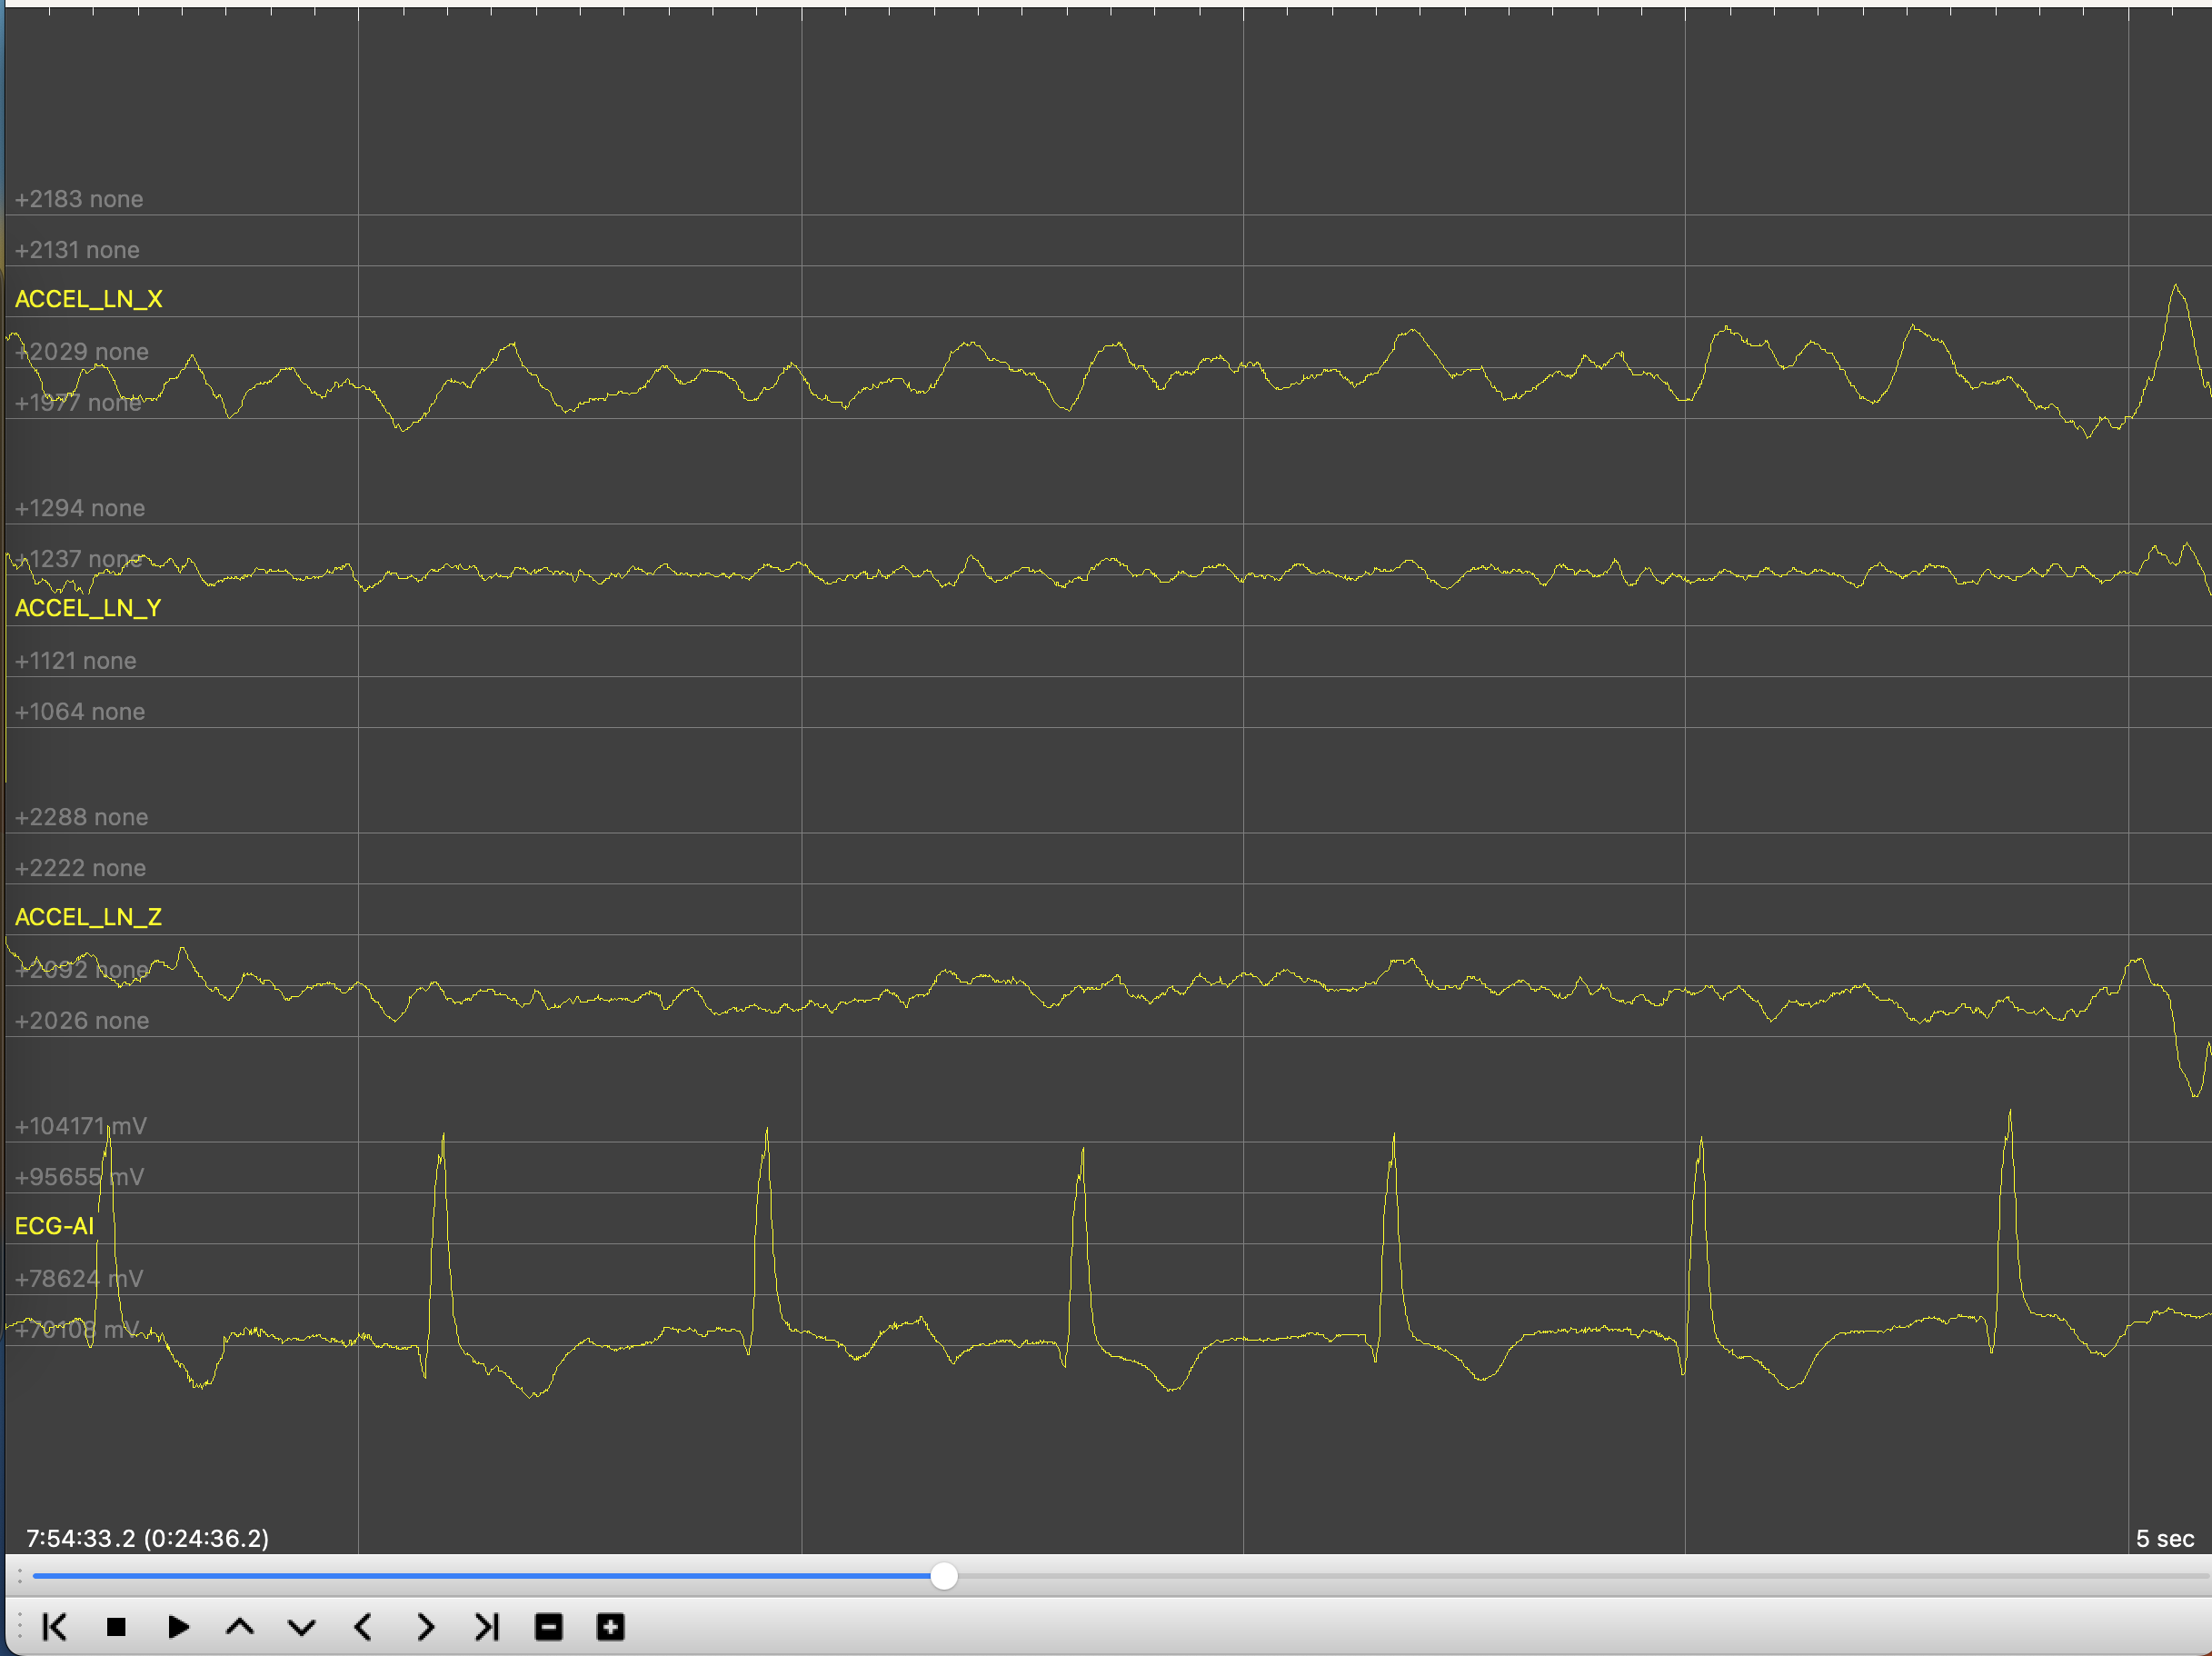
Now we have data that can be loaded into Kubios HRV Scientific which costs about 400$ per year for manual analysis or can be processed automatically with some free open source ECG python libraries like Neurokit. Another option to simple look at data is to use open-source and free EDFBrowser. Here is an example of uncalibrated raw ADC data from accelerometer and single lead ECG:
Some of ECG processing libraries works quite good, but free running conditions require advanced techniques - cleaning of ECG signal, signal quality assessment, RR peak detection, detection of artifacts and ectopic beats in RR data, detrending RR and calculation of HRV indices. I havent found all-in-one single library for that and built my own processing pipeline. Data sampled at 512Hz sampling rate. Here is my (fully automatic) pipeline [3a-d]:
- Clean whole ECG signal with nk.ecg_clean(method = 'neurokit'). See how well neurokit performs in this post. I confirm that default neurokit method for ECG cleaning (which is 0.5 Hz high-pass butterworth filter (order = 5), followed by 50Hz powerline filtering) and peak detection perform really well in my data, comparable to Kubios.
- Divide cleaned signal into segments with sliding window. I compute 15/60/300s segments and use 15/30/60s sliding windows). 15s is user for HR only and 60 secs HRV. 300s Mostly used for nightly sleep.
- Iterate through each segment and detect R peaks with nk.ecg_findpeaks(method='neurokit') which seems to have good enough performance
- After peaks detected it computes ECG signal quality indices (SQI) from this study (rules 1,2,3 and correlation coefficients between average beat). This will be used for discarding bad segments from final dataset.
- Detected R peaks will be cleaned in 2 steps. First step is using nk.signal_fixpeaks(m='Kubios', iterative=True) which will softly clean some of artifacts. In my practice it misses part ectopic beats which i address on next step
- To address ectopic beats which werent clean by Kubios method i will use hrvanalysis python library which in my practice deals good with ectopic beats. Before using it RR peaks should be changed to 1000Hz dimension by multiplication of each R peak by 1000/512 and calculating RR intervals which is difference between adjacent R peaks. RR intervals then passed into hrvanalysis.preprocessing.remove_outliers(low_rri = 300, high_rri = 2000) which returns same array with outliers replaced by Nan value.
- Nan values in RR intervals will then interpolated by using scipy PchipInterpolator and then passed for removal of ectopic beats into hrvanalysis.preprocessing.remove_ectopic_beats(method = 'malik'). There are more methods in that package: amath, karlsson, acar and i've tried them all. Most of time amath and karlsson performed pretty similar to malik and acar sometimes gave too much ectopic beats. Finally i decided to stay with 'malik'.
- Since we removed artifacts and ectopic beats, now we can threat our RR intervals as NN intervals (NN = Normal to Normal) and update ECG quality indices which were calculated for unprocessed R peaks to be based on processed (N) peaks.
- Now we can compute Heart Rate (number of R peaks in 60s period) and mean NN interval. But for most of HRV metrics (rmssd / hf / sd1 / dfa a1/ etc) signal detrending needs to be done and smoothness priors method seems to do that very well for NN and is also being used in Kubios HRV software.
- Before detrending, NN intervals must be converted to continuous signal and here i'm again using PchipInterpolator to fill data between NN intervals and downsample signal to 4Hz and pass it to modified _signal_detrend_tarvainen2002(signal, regularization=500) function from neurokit which seems to have bug - fix is to replace "B = np.dot(np.ones((N - 2, 1)), np.array([[1, -2, 1]]))" to "B = np.dot(np.ones((N, 1)), np.array([[1, -2, 1]]))". I use default regularization value lambda = 500 which is equal to 0.035Hz cut off filter.
- After trend being calculated we need to deduct it from NN intervals and to do that 4 Hz trends should be upsampled to NN intervals sampling rate (1000Hz) and then we can get trend value for each NN interval and deduct it. Now we have detrended NNs which can be used to calculate HRV metrics by passing detrended NNs into hrv() function. But remember that HR and mean NN should be calculated from trended values.
- I would recommend reading chapter 3 (about 2 pages of text) from Kubios HRV manual to understand why all these steps needs to be done. Kubios seems to be a leader in HRV processing software for a long period of time and their pipelines looks pretty solid.
At this point we have quality indices and HRV metrics for each segment and the last step is to remove bad segments. In original study simple approach was used to mark bad segments:
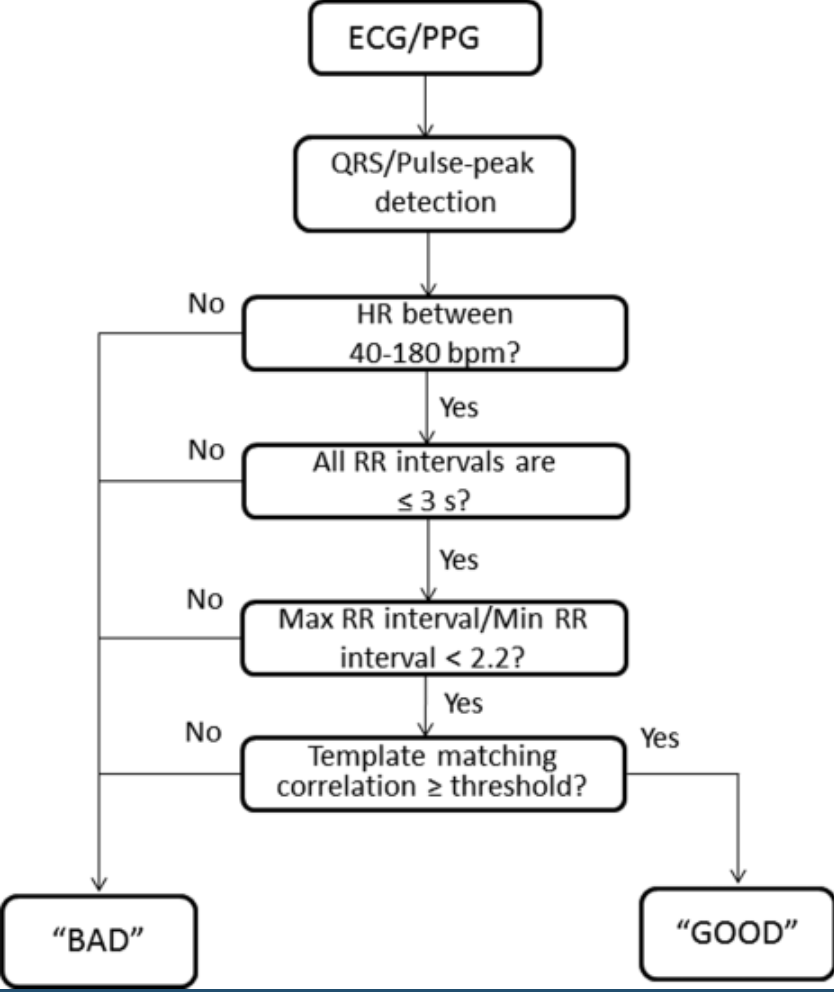 Final rule (template matching correlation) requires some threshold for average correlation coefficient (which calculated for each beat versus averaged beat). We can rely on study results since they have checked performance for different values:
"The optimum threshold for the average correlation coefficient was found to be 0.66 for the ECG SQI and 0.86 for the PPG SQI. On the testing set, this corresponded to a sensitivity of 94% and specificity of 97% for the ECG SQI and a sensitivity of 91% and specificity of 95% for the PPG SQI"
Here i deal with ECG data in free running conditions which may require more strict threshold and i've chosen to go with threshold = .75 (bigger = stricter). This threshold will usually mark 0-5% segments as bad and they will be discarded.
HRV metrics calculated by using neurokit functions with usual parameters [4a-4b]:
- time-domain & non-linear: RR intervals upsampled with pchip interpolation to 1000Hz and detrended
- frequency-domain: RR intervals detrended and resampled to default neurokit 100Hz and [0.15-0.4Hz] for High-Frequency (HF) bands, [0.04-0.15Hz] for Low-Frequency (LF) band. Spectral density estimated by using method 'welch'
- LF band is interpreted as belonging to Baroreflex which may be influenced by SNS vascular activity. Also some of PNS activity may be presented in LF band. There are a lot of inconsistence in scientific publications about this band, novel research points that LF band is mainly related to BRS / PNS and not SNS.
- HF belongs to PNS activity
Here I've covered last parts of HRV guideline:
- 3a IBI calculation and resampling methods IBI artifact identification
- 3b IBI artifact identification method (for example, algorithm, manual inspection) IBI data loss
- 3c Reasons for loss (for example, persistent ectopy, equipment failure) IBI cleaning
- 3d Artifact cleaning methods and the percentage of beats were corrected
- 4a Metrics used and the software/script used for HRV calculation, log transformation (if applicable).
- 4b Specification of frequency bands and how they were interpreted
Results
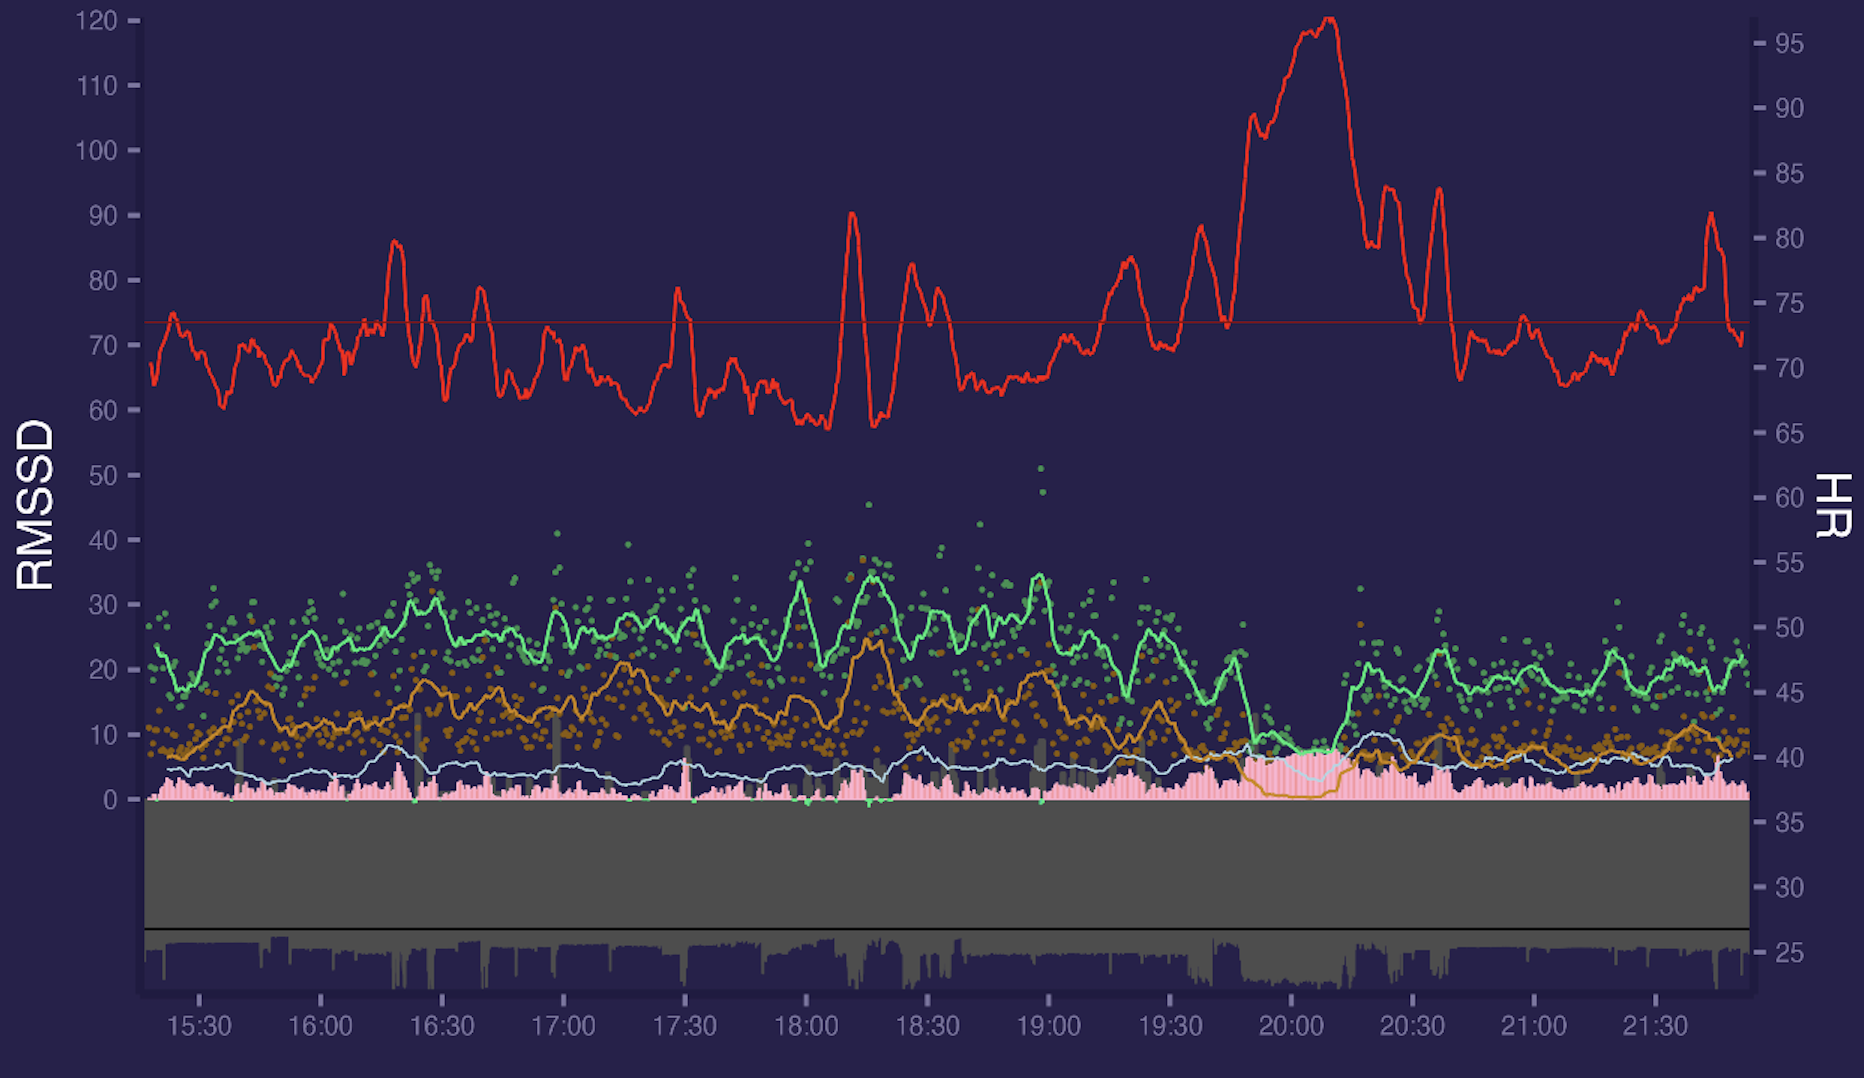
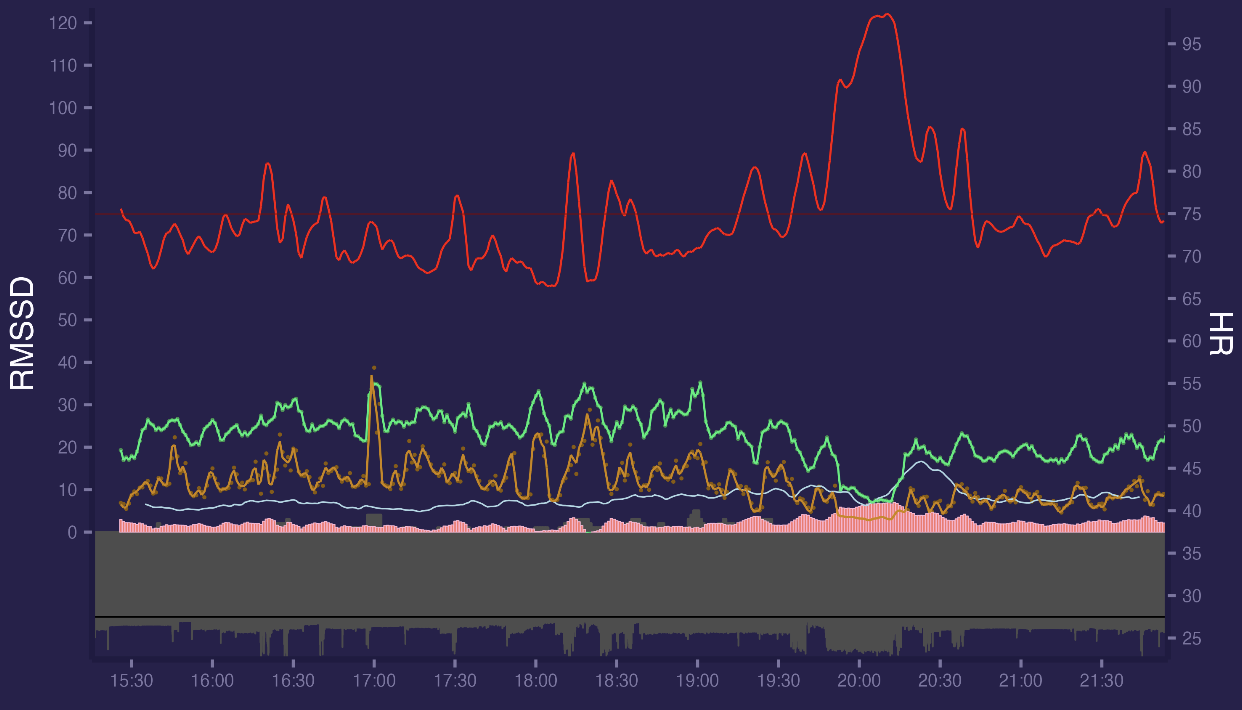
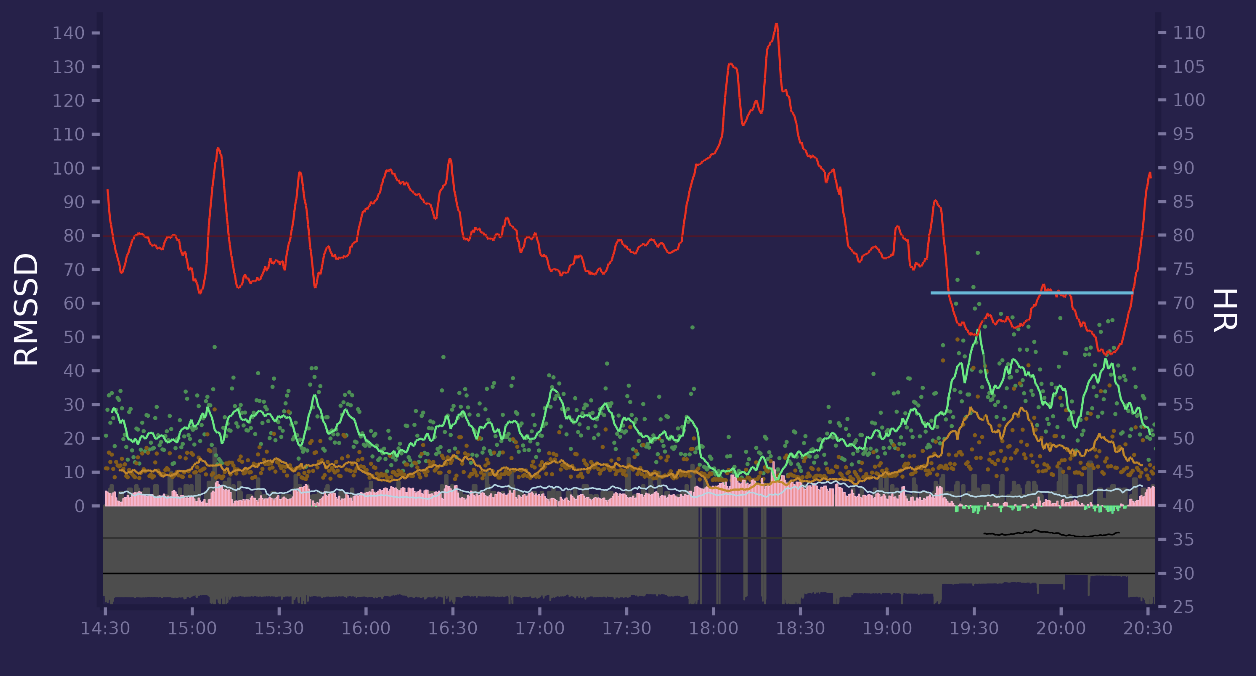
Lets look at final data with ggplot2 R library. This is a daily data from 15:30 to 21:30. Red is HR (right axis scale), green is RMSSD (line is smoothed to 5 mins and points are 60 seconds segment values, left axis scale). Orange line is High Frequency (0.15-0.4Hz) and light blue line is LF/HF. Between 19:40 and 20:20 i have a walk which can clearly be seen with HR increase / RMSSD & HF decrease. 0% segments were marked as bad.
If we increase segment window from 60s to 300s everything becomes smoother:
It seems there were an artifact at 17:00 which doesnt shows up too much on 60s values since they averaged but affects 300s values since their smoothing windows is lower. But overall data looks quite good.
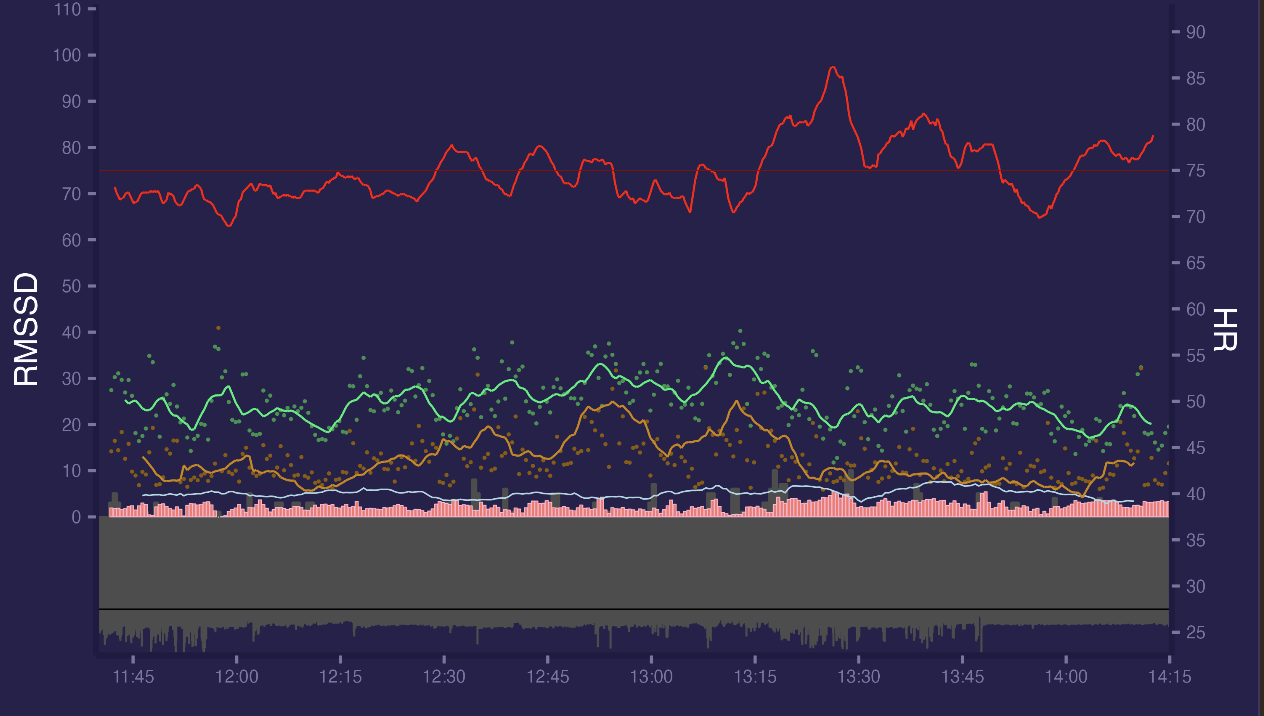
Here is morning data for same day, looks good:
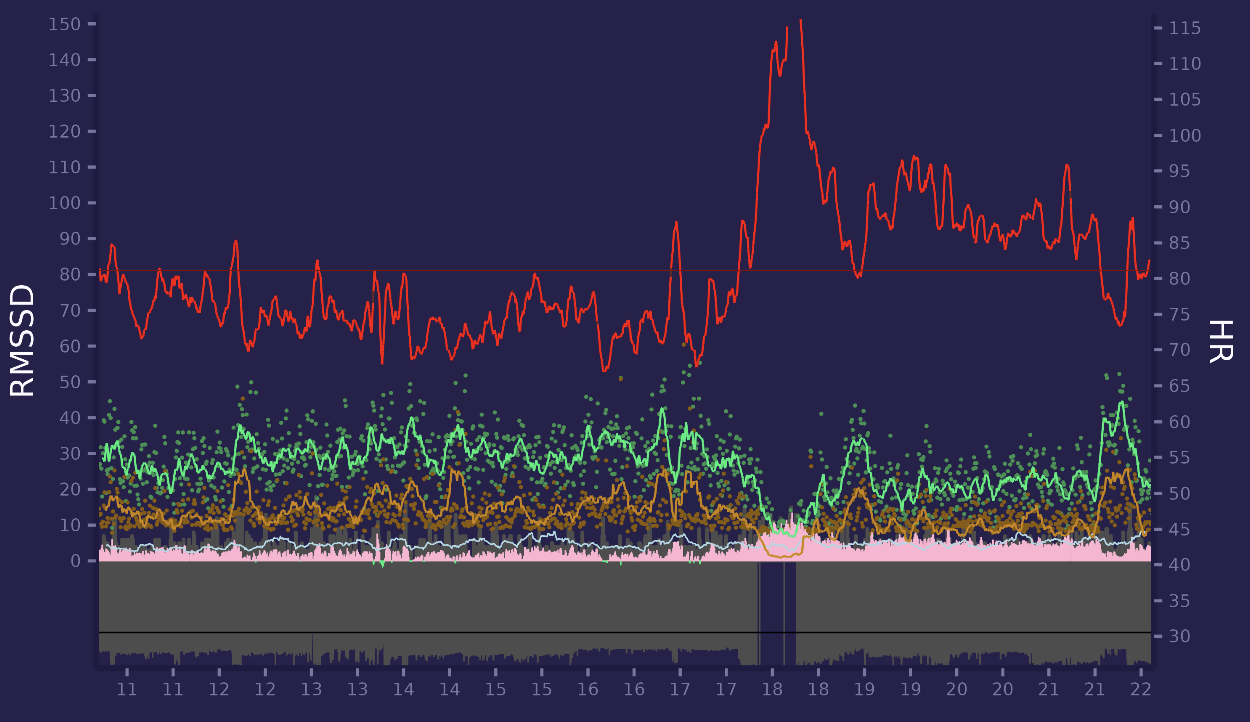
But not all days looks good, sometimes there are more artifacts, example with 3% segments marked as bad.
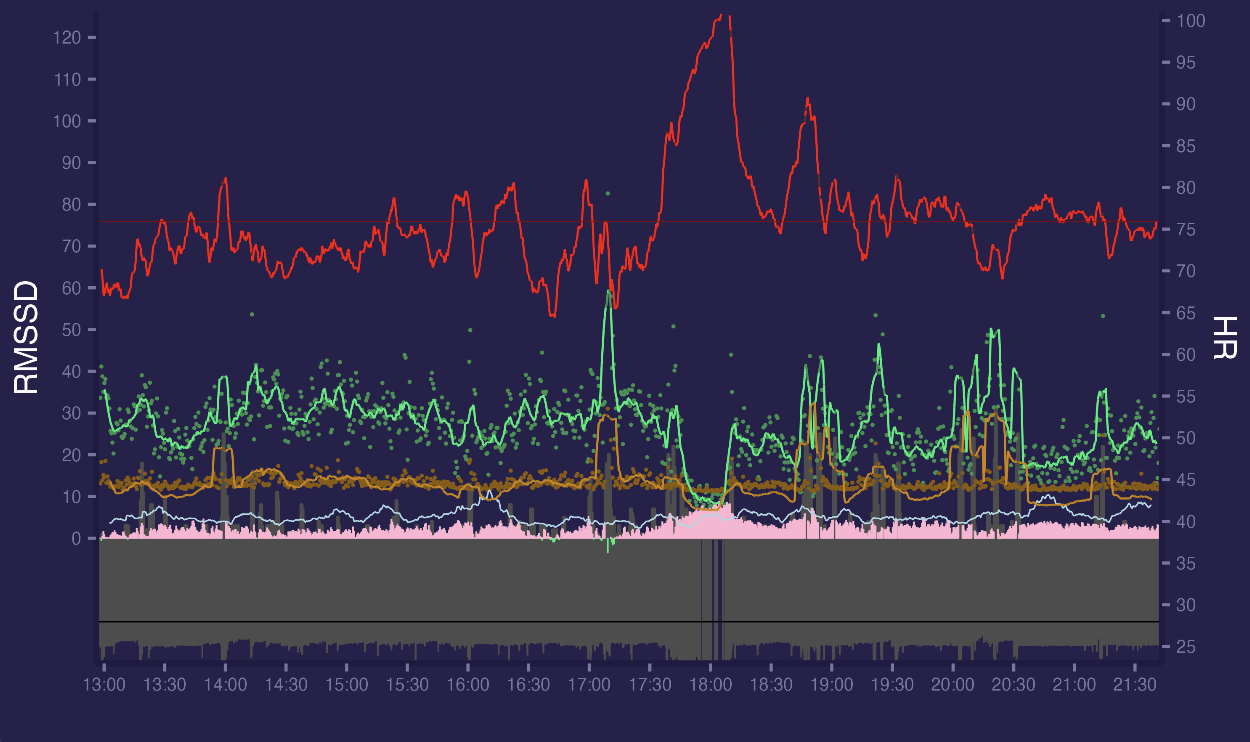
There are also some bad segments which pass threshold and not marked as bad(14:00, 17:15, 19:00, 19:30, 20:00-20:30, 21:15). There were active walking from 17:30 to 18:15 without any artifacts.
Here is another day with massage session at the 19:15 - 20:30 marked as horizontal cyan line.
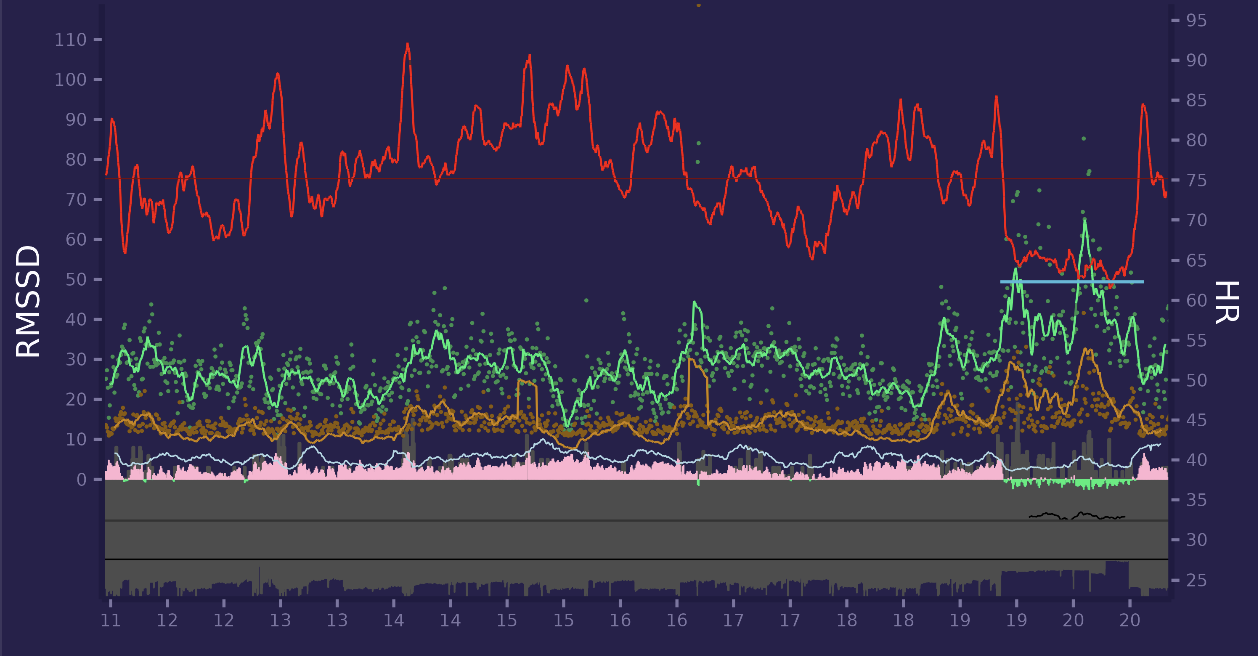
It is clear for me that massage acutely boosts HRV (i have about 10 massage sessions with ECG always look like this one). Small Green/Red filled area around 0 axis is composite stress metric based on HR & HRV values.
Another example with evening walk (17:50 - 18:30) and massage session after (19:15 - 20:15):
Another day with evening walk. At the end of period i was reading book to my child, lying down. You can see increase in HRV.
Here is today morning - i woke up, spent a bit of time in internet and then go to the gym and did some squats (cyan horizontal line):
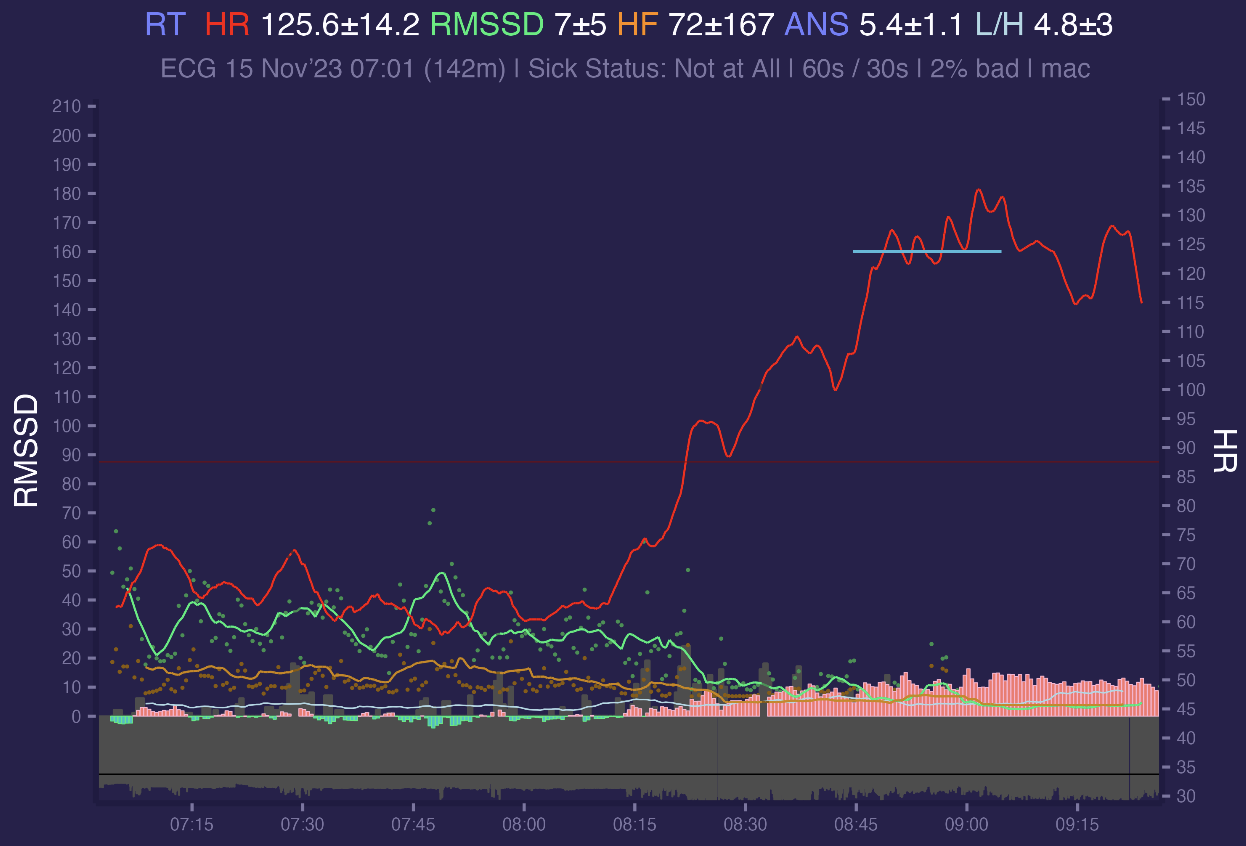
HR line is oversmoothed and we cant clearly see HR peaks for squats in 5 min smoothing period, i'm going to improve that for periods of exercise, because short term 15s values without smoothing represents it better.
Here is one more day with a morning run and evening massage session. There were short relaxation session during the day. Relaxations marked as horizontal cyan lines on a graph:
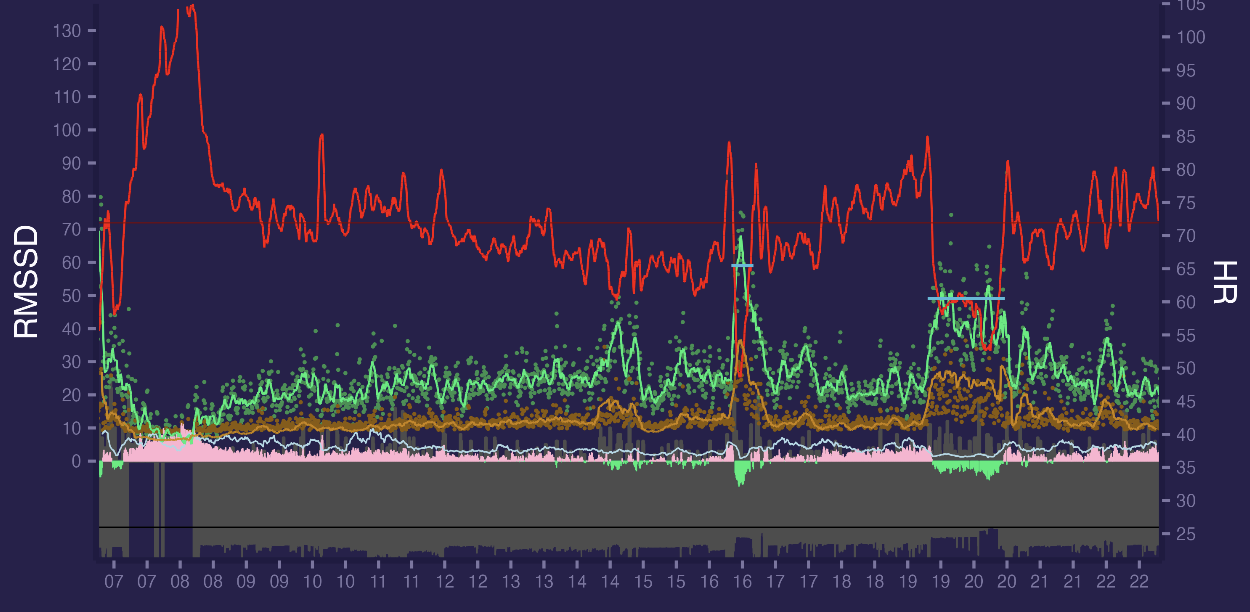
As you can see it is full 15 hours non stopping session in free running conditions with physical exercise, rest and relaxation periods - with almost no artifacts and with different HRV patterns.
Now we can move to sleep data. Sleep data will be merged with hypnograms. I use YASA to classify sleep stages from Hypnodyne ZMax raw EEG data, which sampled at 256Hz from F7-Fpz and F8-Fpz electrodes. Thanks to Rafael Vallat
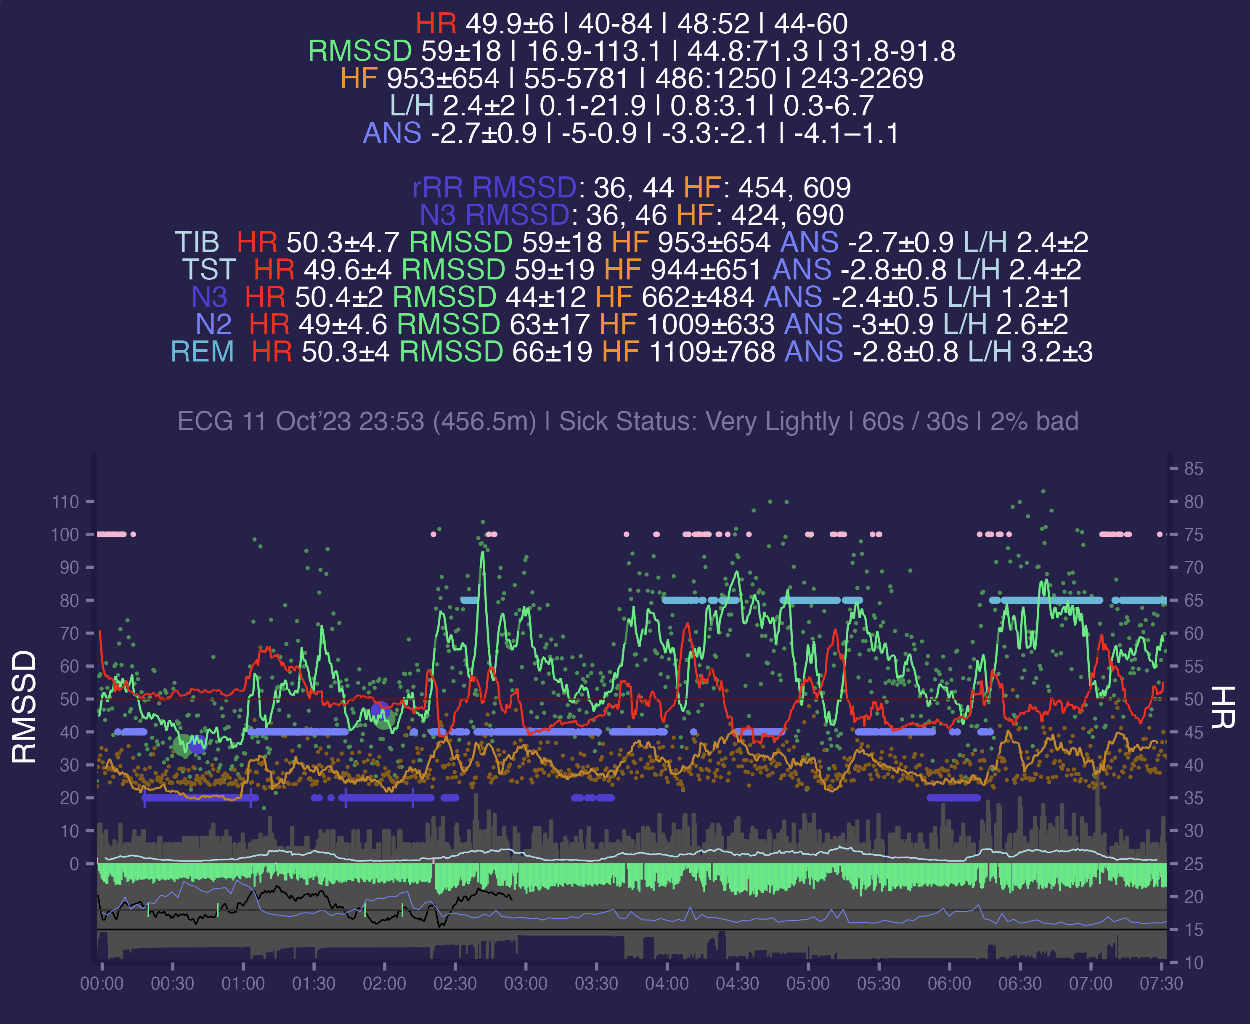
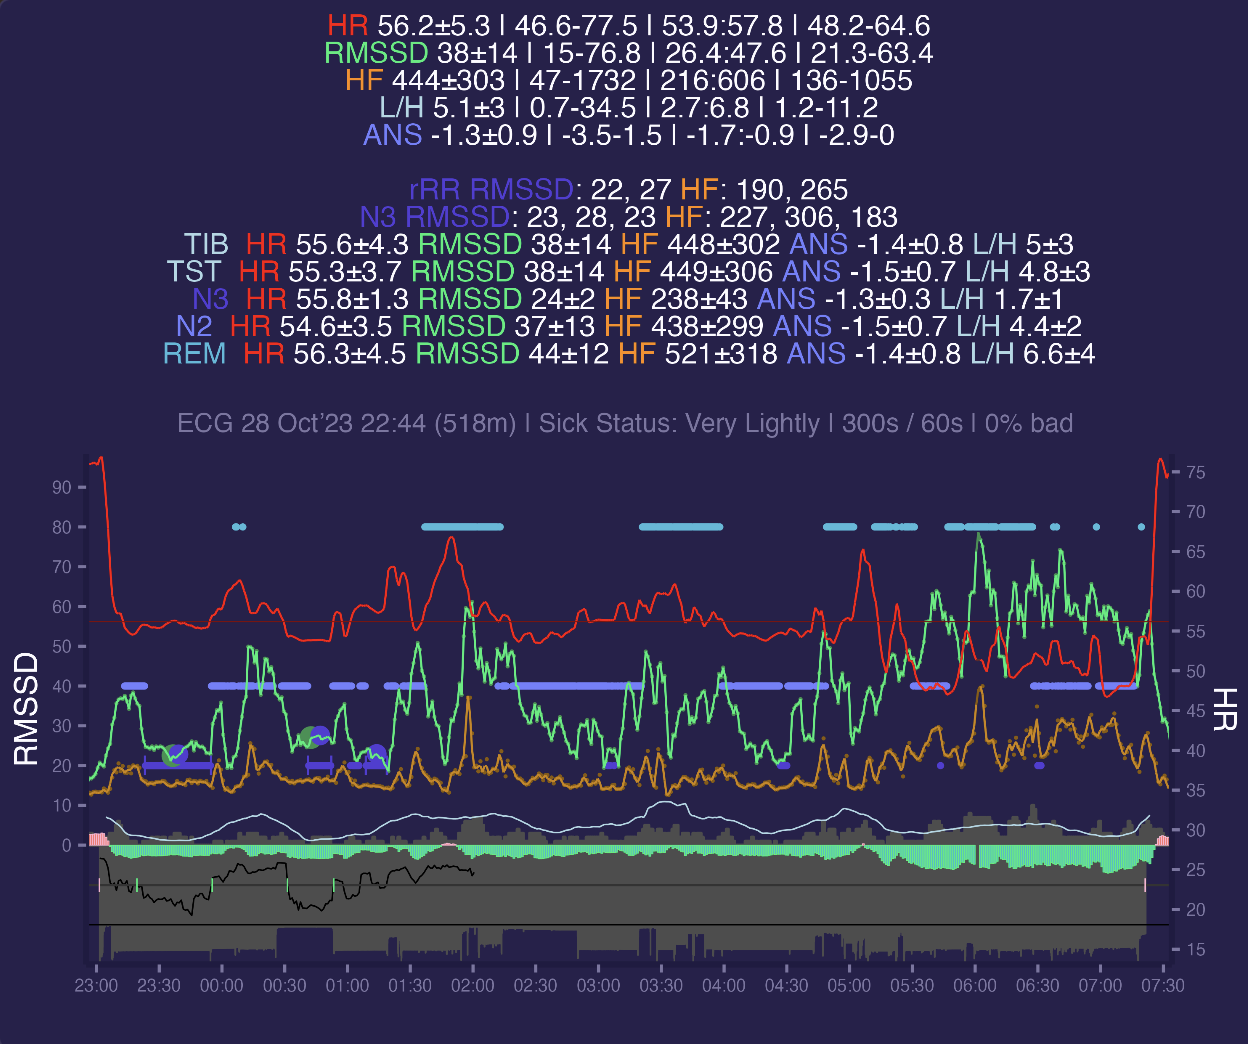
This is my typical night of data. Here i add header with means and standard deviations for context segments. Dark violet horizontal line is Deep sleep (N3) from hypnogram, light violet is Light (N2), cyan is REM and light red is Awake. N1 not showed here.
- TIB segment is time in bed. It incorporates all sleep/wake stages from hypnogram (Awake, N1, N2, N3, REM). We can see that i had a HR of 50.3 and 59ms RMSSD for that period.
- TST is similar to TIB but with Awake removed, so metrics only when i was slept in any stage and were not awake. They look similar to TIB since i awake not too much.
- N3, N2, REM belongs to specific stages. Here we can see difference between these stages in terms of HRV - during N3 heart rate is more stable with standard deviation of 2 compared versus 4-4.6 for N2 / REM. RMSSD is a lot lower 44±12 vs 63±17 in N2 and 66±19 in REM. Also LF to HF ratio is also differs with 1.2±1 for N3 versus 2.6±2 for N2 and 3.2±3 for REM. So from HRV data N3 sleep looks totally different compared to N2 / REM. If we compare N2 vs REM they are not so different in HR / RMSSD but seems to have some of difference in LF/HF ratio mean and standard deviation
HRV during deep sleep
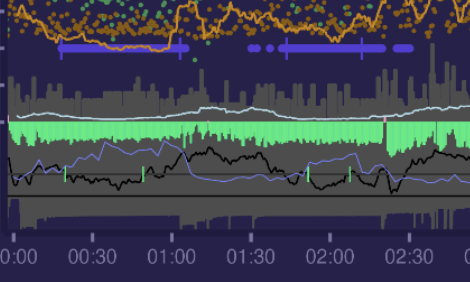
There are some studies (like this or that) which investigated SWS (slow wave sleep = deep sleep = N3) as pretty stable and perfect time to measure HRV for Autonomic Nervous System (ANS) assessment. This is because during SWS sleep we not moving too much, have stable breathing and HR, less responsive to sound and other external stimuli. All these factors affect HRV and during SWS their impact is minimised making SWS a perfect time for comparable and reproducible HRV measurements. Usually HRV asessed during 5 minutes segment in a middle of first N3 segment which last at least 10 minutes and happens in a first half of night. Here i've computed N3 segments in same way - first half of night, look for at least 10 minutes segment, find mid point of segment and calc HRV metrics for 5-min period placed on mid point. There is a dark violet header line N3 RMSSD with 36ms RMSSD for 1st segment and 46 ms on a second. These points marked as big violet points on a graph.
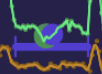
Sport science also investigates HRV during SWS and there are attempts to find middle point of N3 sleep with ECG only data. Outside SWS sleep RR intervals correlate pretty well with themselves shifted by 1 interval forward: RR[1:n] correlate pretty well with RR[2:n+1]. But during SWS there is huge drop in that correlation and current beat does not correlate well with next. So the idea to calc correlation coefficient for RR intervals (rRR) in each segment and find periods of low correlation, where low is defined as less than specific threshold (less than .9 of mean rRR). During SWS the delta (slow) frequency power is at highest values and in these studies they have found that rRR and delta power showing inverse patterns. Here i calculated EEG Delta Power from ZMax and rRR for Shimmer ECG and plotted it below x axis:

Violet line is EEG Delta Power and black line is rRR from HRV. Dark grey line is .95 mean rRR threshold (i use a bit higher than .9 from actual study). We can clearly see that when delta power increases the rRR goes down and vice verca.
Here we can see that low rRR periods (marked as short green vertical green lines) located inside real N3 sleep segments (solid violet lines at the top). That happens most of my nights and is a pretty stable pattern. From here we can see that for that specific night HRV of N3 segment from EEG data matches pretty well with HRV of low rRR segment from ECG data. 1st segment is equal and 2nd have only slight difference.
Big green points are N3 RMSSD from low rRR segments.
Lets move on to the stress: the green area around green axis is a same stress metric as on day graphs. Here we can see sympathetic dominance - red area above x axis. There some rest periods where parasympathetic dominance occurs - massage and relaxations sessions.
![]()
Here we can see a restful night where our parasympathetic nervous system (PNS) is dealing with accumulated daily stress:
![]()
Here is 300s window HRV segments with a bit wide timeframe where we can see how stress metrics flips before and after sleep:
Here i'm going to sleep and parasympathetic system start dominating putting ANS into recovery mode - red area changes to green:
But when i wake up in the morning opposite happens - sympathetic systems activates to start dealing with daily stressors. Green area changes to red.
ANS Stress Index
Index i'm using is based on healthy population mean and standard deviations for some HRV metrics:
PNS branch, higher value means less stress:
- Mean RR: 926 ± 90
- RMSSD: 42 ± 15
- SD1 normalized: 0.316 ± 0.112
SNS branch, higher values means more stress:
- HR: 65.5 ± 7.7
- Baevsky Stress Index: 100 ± 50
- SD2 normalized. 0.683 ± 0.212
This naming may not represent reality, since we can argue that HRV mainly describes parasymphatetic (PNS) activity and not symphatethic (SNS). So we may look at this SNS metric not as direct SNS activity but as opposite to PNS, which may be mix PNS deactivation and SNS activation or just PNS deactivation. So final ANS stress index may be mostly based on PNS activity and contain small part of SNS activity.
For example, if I have a HR = 100 bpm that means that i'm 34.5 bpm far from average resting person (which have 65.5 bpm). Since standard deviation is 7.7 bpm that means that i'm 34.5/7.7=4.5 standard deviations (SD) away from average. If we calc difference in SD units (z-scores) then sum of z-scores for HR + BSI + SD2n represents SNS index and sum of z-scores for mRR + RMSSD + SD1n represents PNS activity.
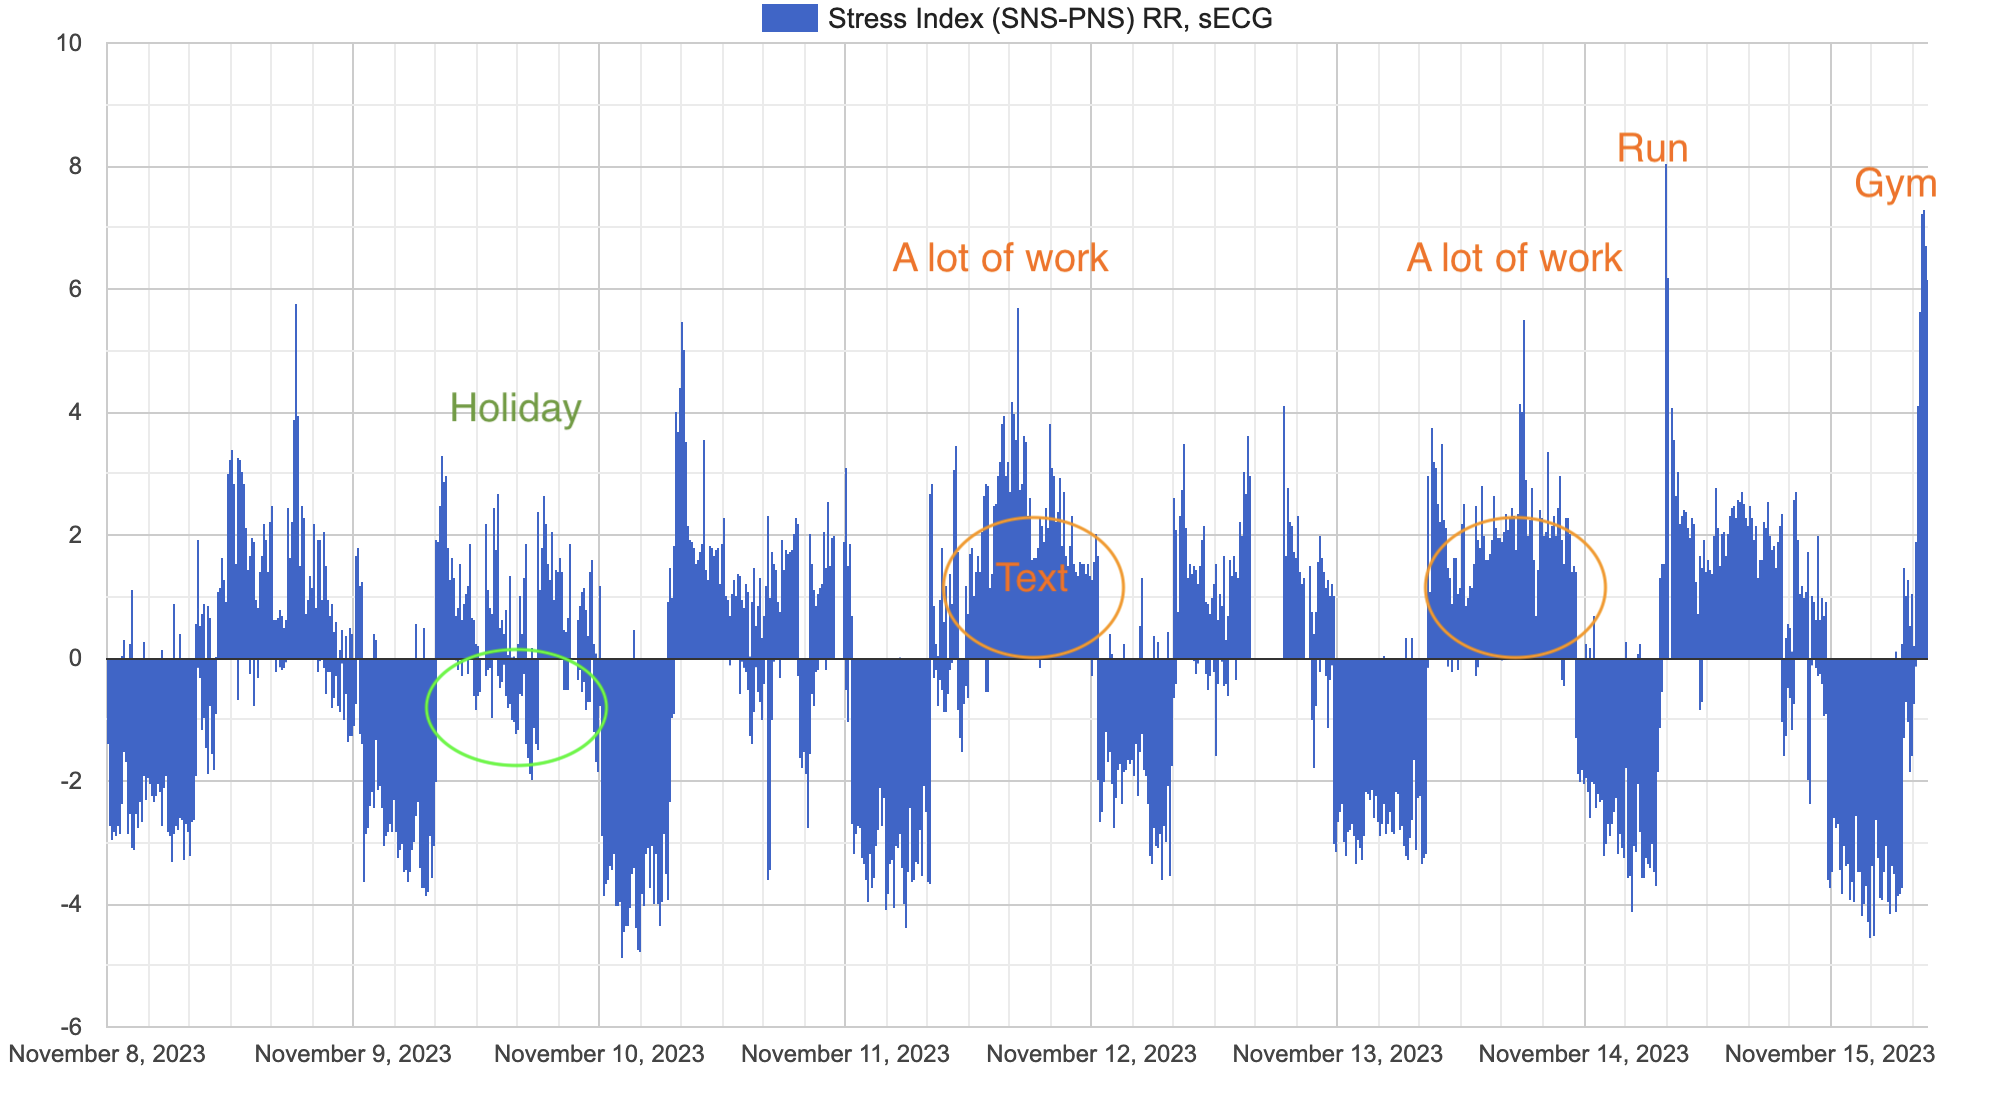
Finally i calculate ANS Stress Index by substracting PNS index from SNS index. That means when SNS is high we have positive values which will be above x zero axis on my graph colored in red, otherwise when PNS is on high then values will be negative and placed below x zero axis and i color them as green. This index seems to be pretty informative and agrees with my subjective stress perception. If you interested you can go back to daily graphs and look at it.
Here is my ANS Stress index over ~10 days (plot differs in style because this one is from my web ui). Some days seems to be more stressful than others. Sleep periods are easily identified just by looking at ANS stress balance. 9 Nov i had a holiday and stay in hotel with little amount of work, mostly relaxing - we can see not too much daily stress with some of parasympathetic dominance even during day. Right side of graph is today morning squats in a gym and yesterday (14 Nov) a had a running session.
Ectopic beats
ECG processing pipepline requires finding out ectopic beats and we can visualize them:
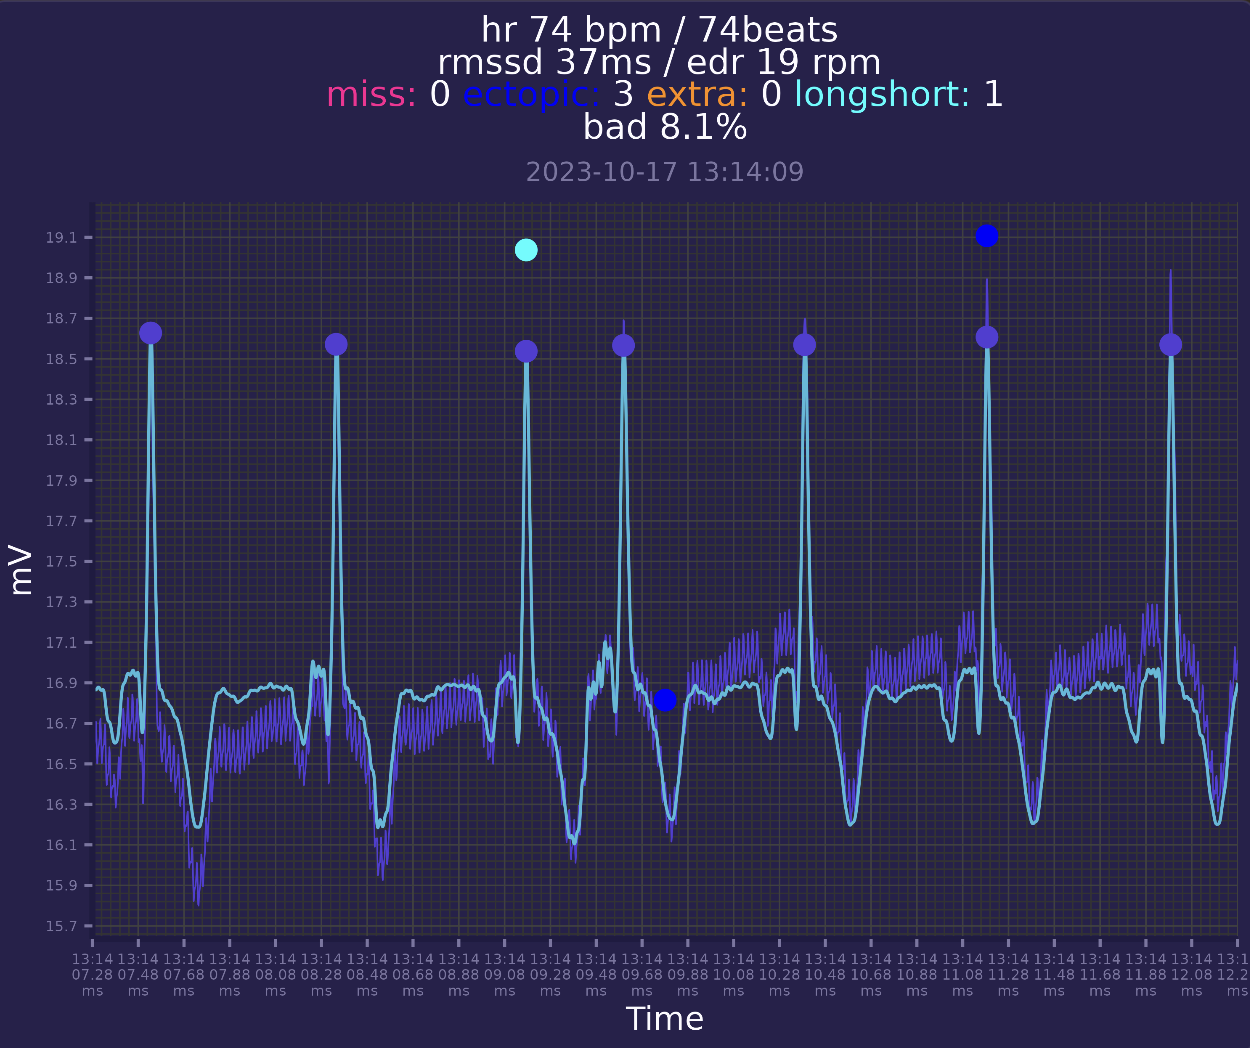
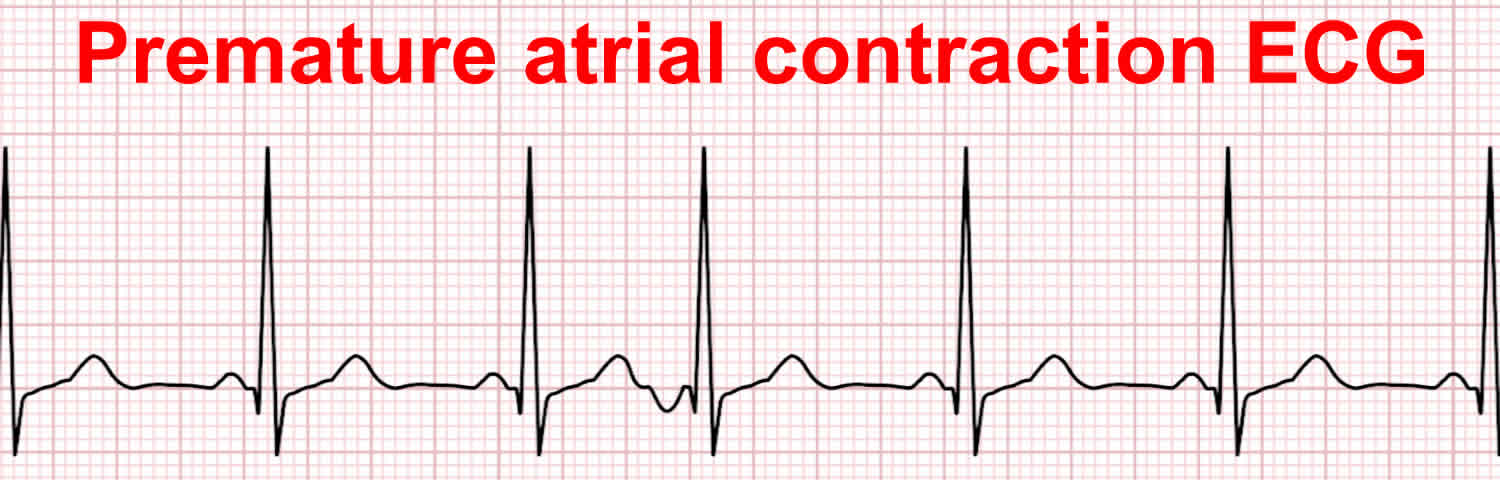
Here is example of ectopic beat. It seems to be a PAC - premature atrial contraction. It is an a extra beat which occurs to early and have usual P-QRS-T shape.
I'm getting ~200-400 PACs every day, one day i got around 1000. For now 200-400 seems to be in a healthy range. For now i continue learn more about cardiology.
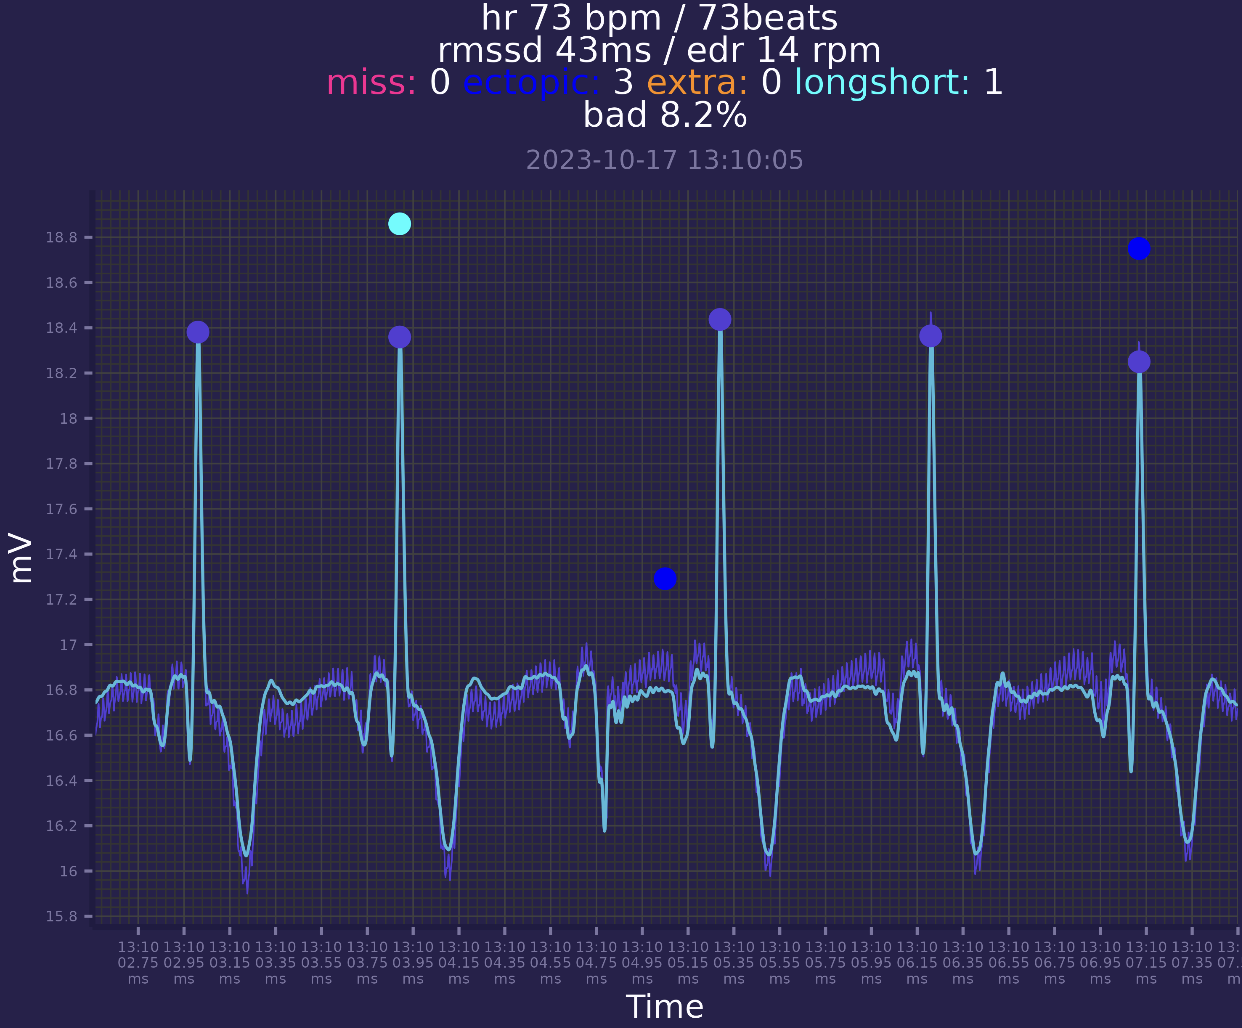
There are another example of weird beat without R peak:
Recently, i have felt few too fast heartbeats, immediately stopped ECG recording to check what that was. I've just opened raw data in EDFbrowser since i know that event happened at the end of session:
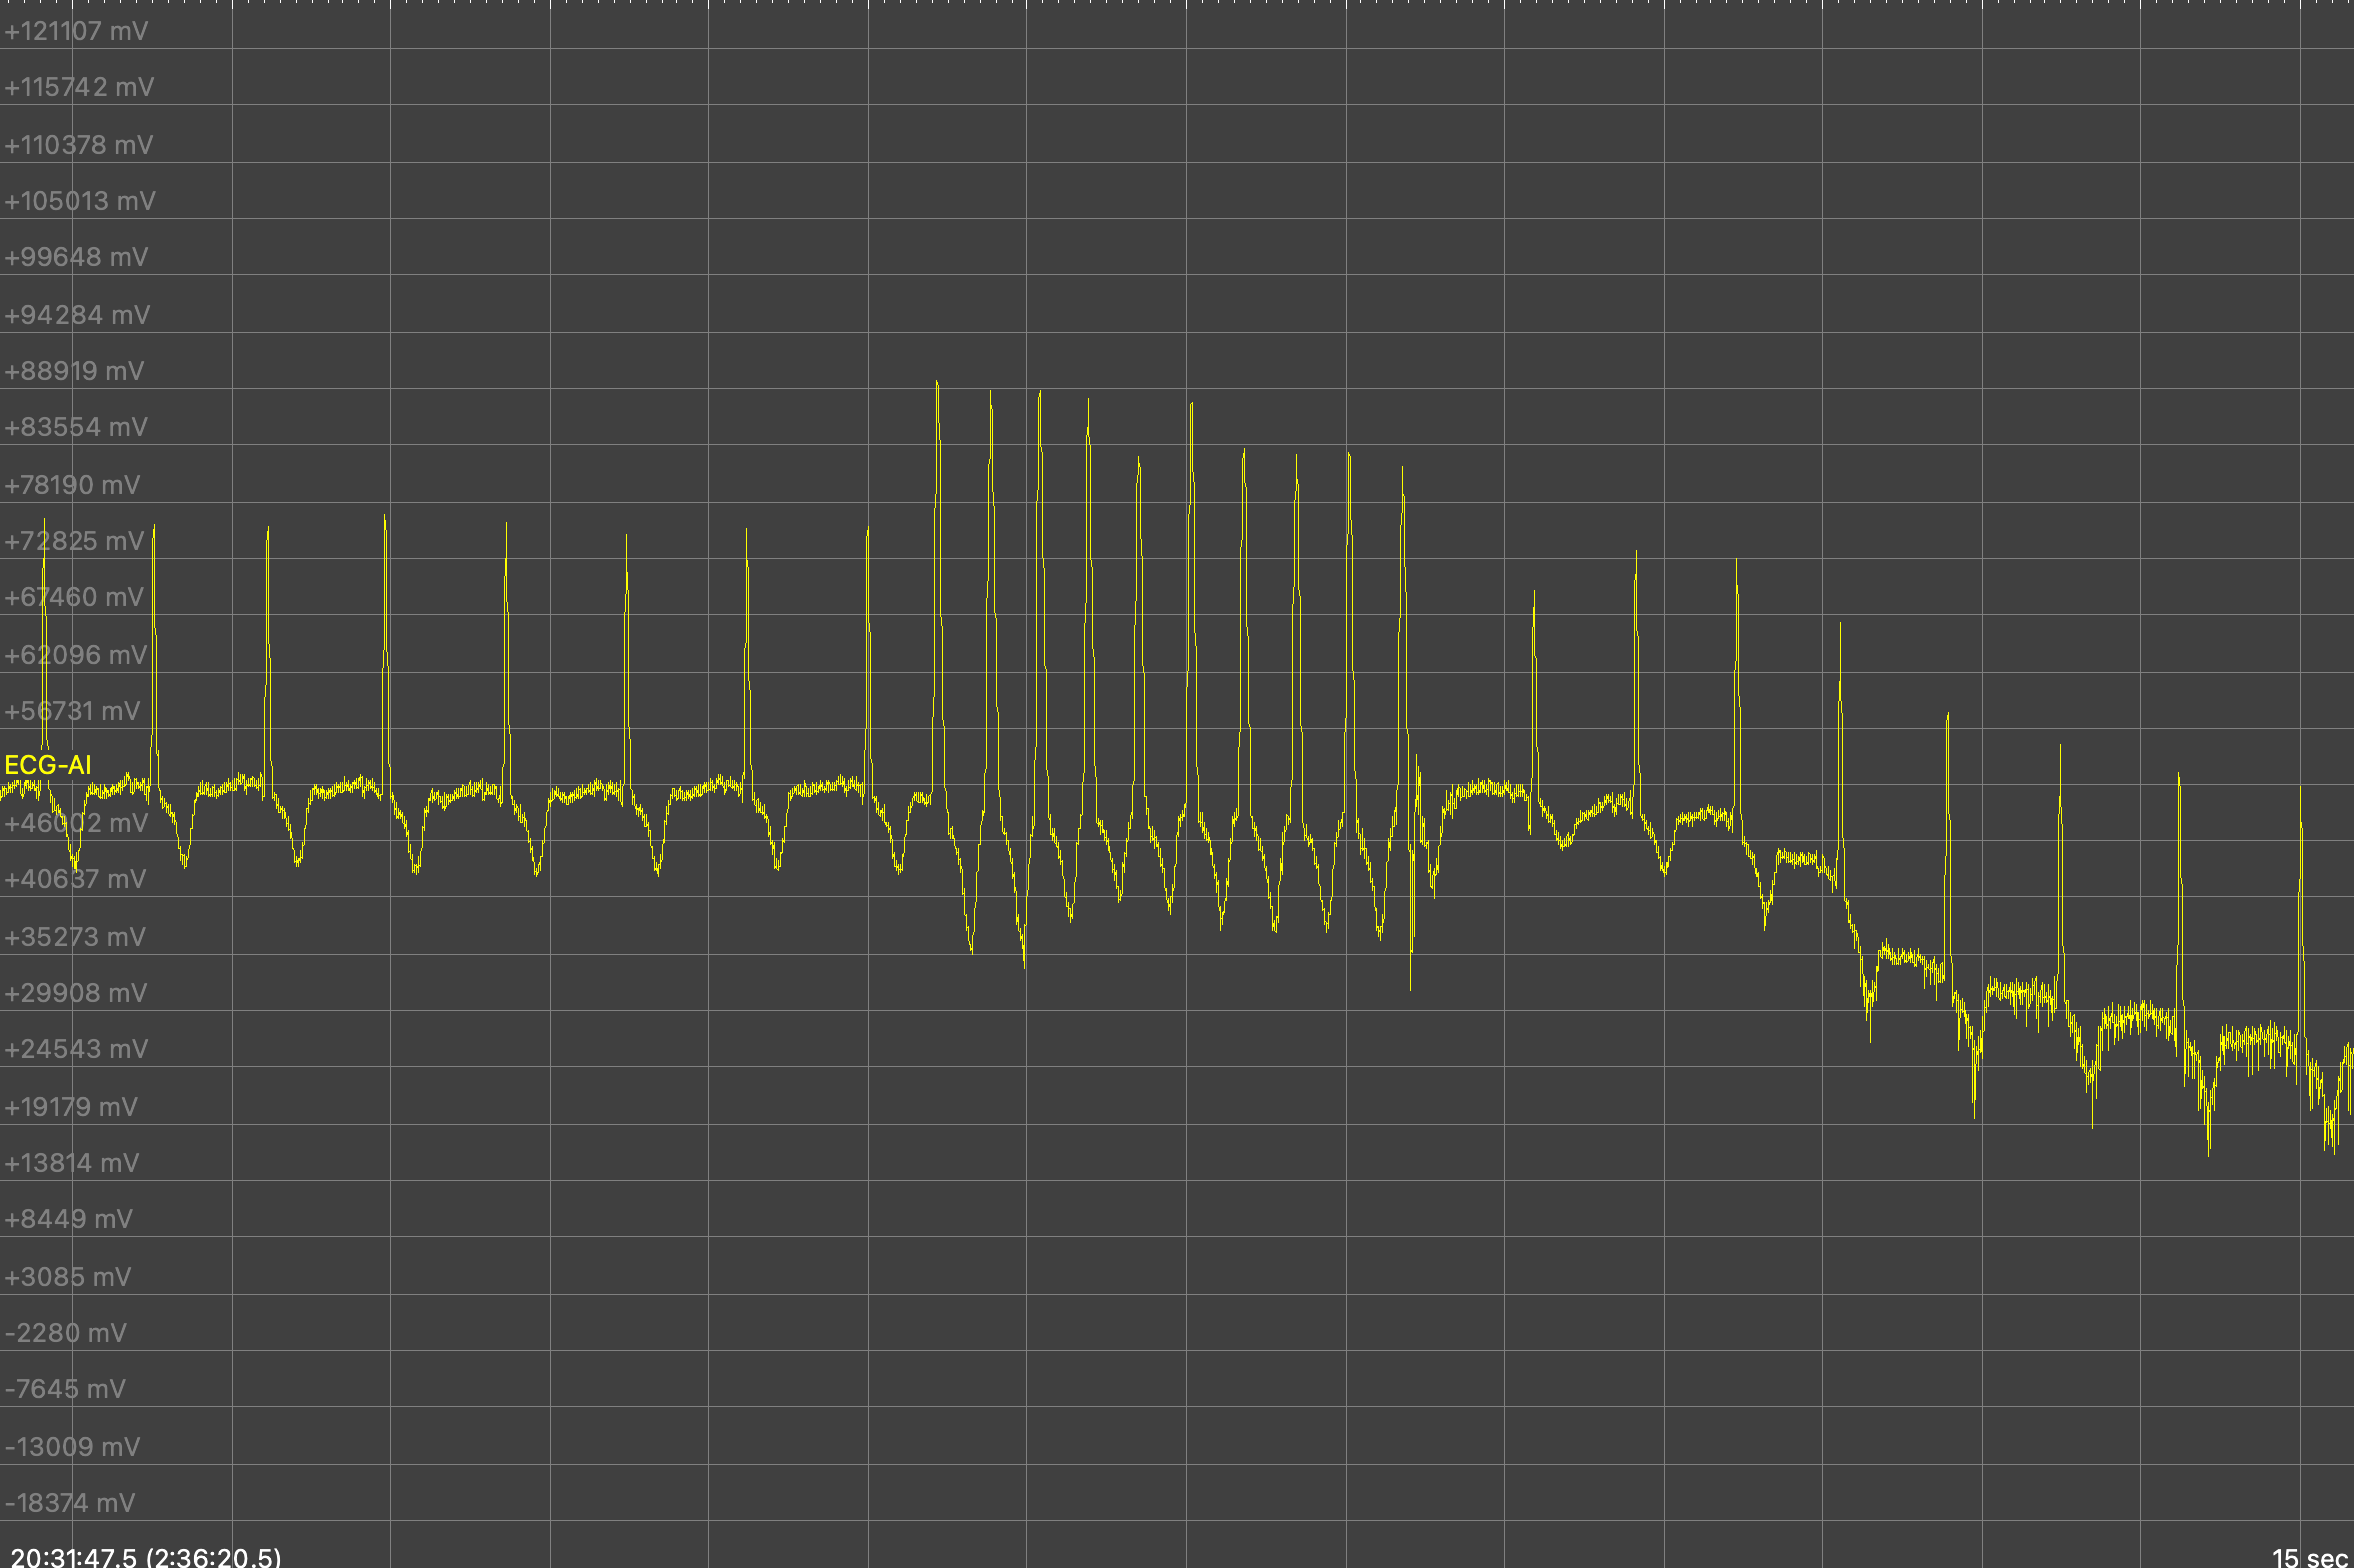
It seems to be paroxysmal tachycardia, another type of arrythmia.
There are some python libraries which can be used to find more anomalies in ECG, but i didnt tried them yet.
Final thoughts
For now i'm going to keep collecting 24/7 ECG data and nightly EEG data for future deep analysis. From now i can summarise my current results:
- I was able to built a framework for collecting high quality ECG 24/7
- I have found a way wearing ECG device and electrodes with acceptable comfort and without limitations which works even during exercise conditions. This allows me to keep using this approach in long term and collect some useful data.
- I was able to reproduce some HRV sleep studies which points me that my data processing pipeline is good enough
- Currently i spent only a few minutes per day to keep this running - because data extraction, processing and visualising is fully automated. After i put device in dock - everything is done without my involvement. My script automatically process data and sends automatically generated plots to telegram channel. Most of plots from this post was autogenerated. At any time i can go to my personal web dashboard and visualise multiple metrics.
Here i've presented what insights i have gotten from ECG analysis:
- Found abnormal beats. Now i know that i have 200-400 PACs and sometimes even more. I'm going to keep collecting data to find out if i have another anomalies. Also i could try to see if there are patterns that lowering PACs count.
- Catched paroxysmal tachycardia event. I'm going to read more about it
- I've reproduced HRV during SWS from some studies and confirmed that SWS HRV may be derived from ECG only with some accuracy. I'm going to keep collecting HRV during SWS and will try to find connections to physical activities and other features of interest. If it works good i may stop doing morning standing HRV test which result in spending less time to measure things (standing HRV test takes 2 minutes every day)
- Calculated stress index which correlates well with my stress perception and can be used to measure balance of stress / recovery.
- Have confirmed that relaxation from massage acutely increases HRV which is a good sign. In addition to massage, i'm going to try different meditations.
- I plan assess accuracy of Fitbit Charge 6, Oura ring 3 - devices i wear every day (coming soon). I'm stunned that my new Fitbit Charge 6 all-day 1-min average heart rate have .98 correlation with ECG HR for 2 days (~2000 data points), but these are preliminary results.
Thats all for now.
Setup
This is my setup, someone may be fine with a single unit.
- 1 or 2 Shimmer Ebio units
- At least one dock with usb cable, which usually comes with device, but also sold separately
- Waist strap and and leads which also comes with device
- any snap ECG electrodes with Ag/AgCl coating should work. Bigger is disk preferred
- Tensive conductive gel
- Windows laptop for GUI software which i still use sometimes
- Macbook Pro (m-series) for data processing pipeline (can be easily changed to Linux)
Device have multiple leads, but i use minimal setup to maximise comfort in long term use.
- I use 512Hz sampling frequency
- I've replaced default slow 8GB SD card with 32GB Sandisk class 10 SD card to speed up data copying
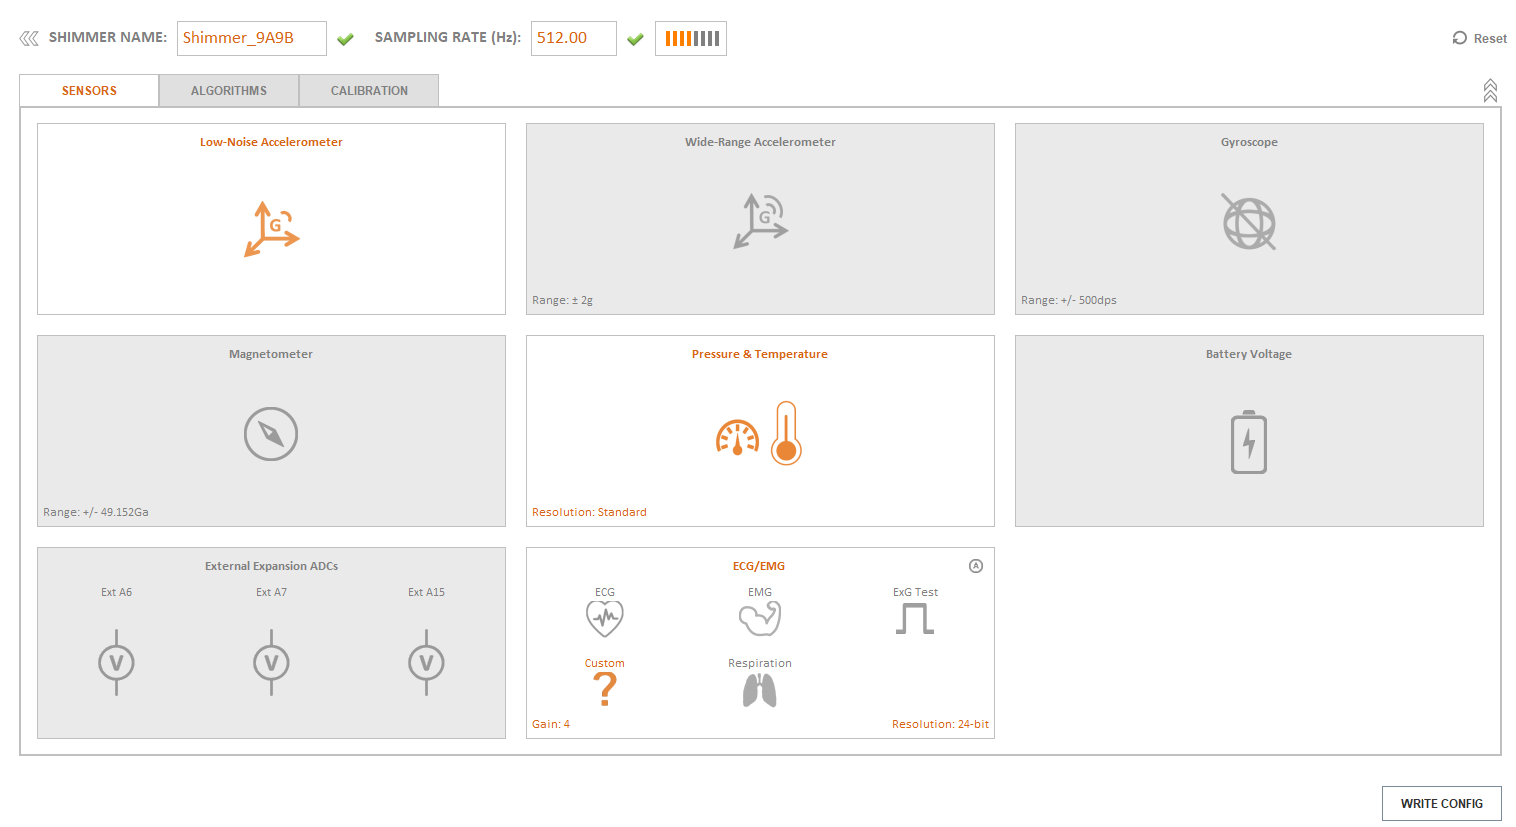
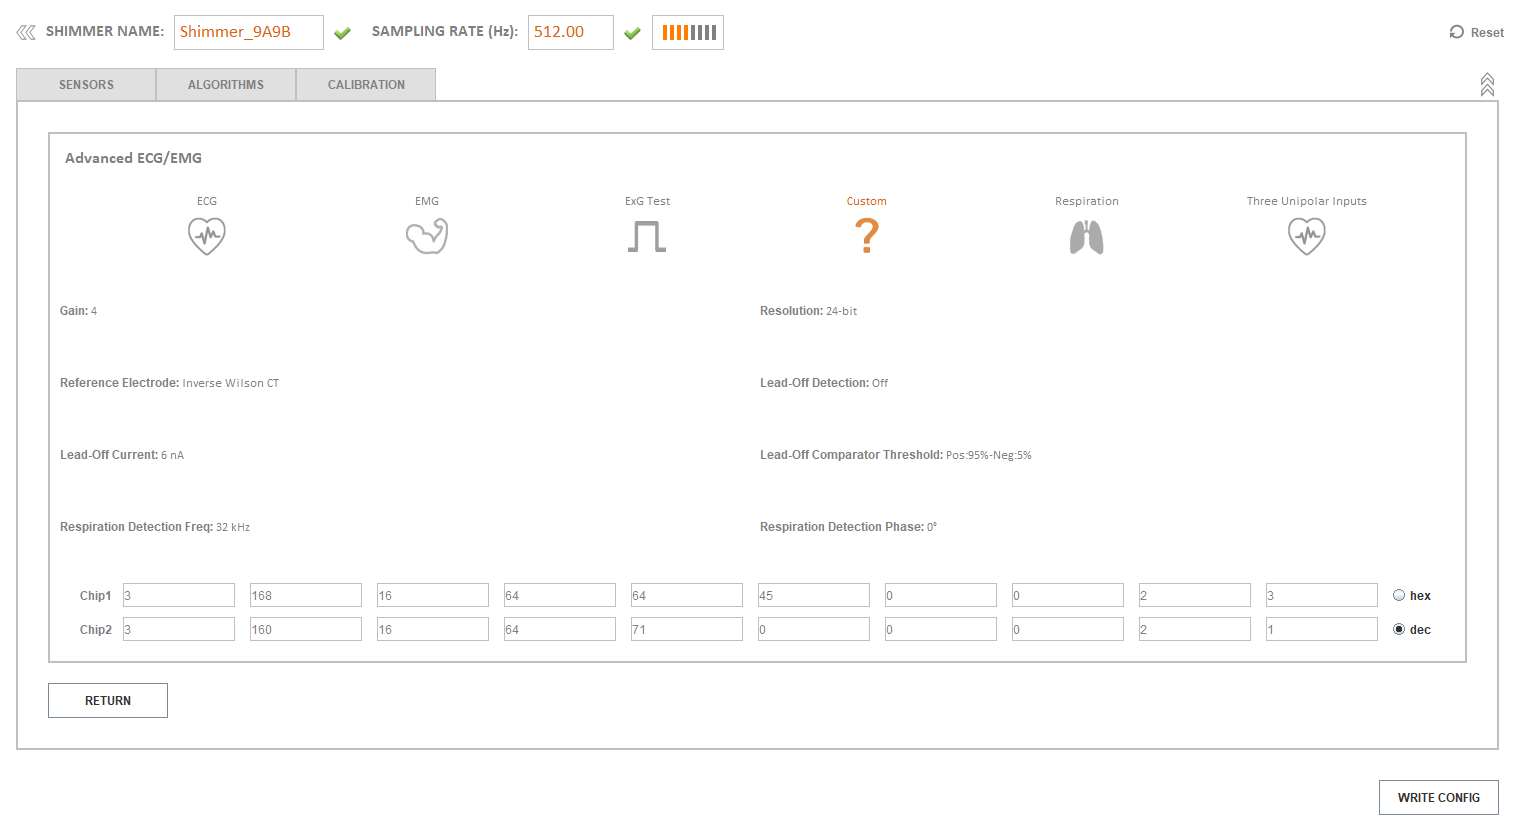
- Device have 2 ADC chips and i disabled second one for power saving. I use 1-lead setup which utilize only one ADC.
- Here is full configuration from Consesys software
- I've calibrated accelerometer, gyroscope and magnetometer but thats not required
- I'm using Log and Stream firmware 0.15.4
I start recording by pressing hardware button on device and stop it with same button.
Data pipeline
I'm going to publish my python code which will have few parts
- Reading raw ADC data from device on dock
- Backing up data to external folder
- Read, interpolate and save uncalibrated ADC values to BDF and calibrated ADC values to CSV files into another folder
- Read raw ADC values from BDF file, calibrate ADC values and start ECG processing pipepline
ECG processing pipeline will be separated and will consists of
- cleaning ECG signal
- detect peaks
- calculate quality indices
- 1st round of cleaning peaks
- 2nd round of removing ectopic beats
- detrending of peaks with smoothness priors
- calculate HRV metrics from detrended peaks with a moving window
Main reason of publishing this code is ability to reproduce my results (i plan to publish paper in a science journal), so it will not be like a service ready for production. Also it is adapted for my specific use-case which may not suit everyone. My python skill is somewhere between jun/mid so code may look weird :)
21 Nov 2023: first version of ECG processing pipeline used here is published at Github.
References
- Cao R, Azimi I, Sarhaddi F, Niela-Vilen H, Axelin A, Liljeberg P, Rahmani AM. Accuracy Assessment of Oura Ring Nocturnal Heart Rate and Heart Rate Variability in Comparison With Electrocardiography in Time and Frequency Domains: Comprehensive Analysis. J Med Internet Res. 2022 Jan 18;24(1):e27487. doi: 10.2196/27487. PMID: 35040799; PMCID: PMC8808342.
- Jeyhani V, Mantysalo M, Noponen K, Seppanen T, Vehkaoja A. Effect of Different ECG Leads on Estimated R-R Intervals and Heart Rate Variability Parameters. Annu Int Conf IEEE Eng Med Biol Soc. 2019 Jul;2019:3786-3790. doi: 10.1109/EMBC.2019.8857954. PMID: 31946698.
- Samuel Pröll. ECG R peak detection in Python: a comparison of libraries. https://www.samproell.io/posts/signal/ecg-library-comparison/
- Orphanidou C, Bonnici T, Charlton P, Clifton D, Vallance D, Tarassenko L. Signal-quality indices for the electrocardiogram and photoplethysmogram: derivation and applications to wireless monitoring. IEEE J Biomed Health Inform. 2015 May;19(3):832-8. doi: 10.1109/JBHI.2014.2338351. Epub 2014 Jul 23. PMID: 25069129.
- Makowski, D., Pham, T., Lau, Z. J., Brammer, J. C., Lespinasse, F., Pham, H., Schölzel, C., & Chen, S. A. (2021). NeuroKit2: A Python toolbox for neurophysiological signal processing. Behavior Research Methods, 53(4), 1689-1696. https://doi.org/10.3758/s13428-020-01516-y
- Robin Champseix. hrvanalysis is a Python module for Heart Rate Variability analysis of RR-intervals built on top of SciPy, AstroPy, Nolds and NumPy. https://aura-healthcare.github.io/hrv-analysis/
- Tarvainen MP, Ranta-Aho PO, Karjalainen PA. An advanced detrending method with application to HRV analysis. IEEE Trans Biomed Eng. 2002 Feb;49(2):172-5. doi: 10.1109/10.979357. PMID: 12066885.
- Kubios HRV Scientific Users Guide. https://www.kubios.com/downloads/HRV-Scientific-Users-Guide.pdf © 2016-2023 Kubios Oy
- Vallat, Raphael, and Matthew P. Walker. "An open-source, high-performance tool for automated sleep staging." Elife 10 (2021). doi: https://doi.org/10.7554/eLife.70092
- Brandenberger G, Buchheit M, Ehrhart J, Simon C, Piquard F. Is slow wave sleep an appropriate recording condition for heart rate variability analysis? Auton Neurosci. 2005 Aug 31;121(1-2):81-6. doi: 10.1016/j.autneu.2005.06.002. PMID: 16005265.
- Herzig D, Eser P, Omlin X, Riener R, Wilhelm M, Achermann P. Reproducibility of Heart Rate Variability Is Parameter and Sleep Stage Dependent. Front Physiol. 2018 Jan 10;8:1100. doi: 10.3389/fphys.2017.01100. PMID: 29367845; PMCID: PMC5767731.
- Al Haddad H, Laursen PB, Ahmaidi S, Buchheit M. Nocturnal heart rate variability following supramaximal intermittent exercise. Int J Sports Physiol Perform. 2009 Dec;4(4):435-47. doi: 10.1123/ijspp.4.4.435. PMID: 20029095.
- Herzig D, Testorelli M, Olstad DS, Erlacher D, Achermann P, Eser P, Wilhelm M. Heart-Rate Variability During Deep Sleep in World-Class Alpine Skiers: A Time-Efficient Alternative to Morning Supine Measurements. Int J Sports Physiol Perform. 2017 May;12(5):648-654. doi: 10.1123/ijspp.2016-0257. Epub 2016 Sep 26. PMID: 27768512.
- Quer G, Gouda P, Galarnyk M, Topol EJ, Steinhubl SR. Inter- and intraindividual variability in daily resting heart rate and its associations with age, sex, sleep, BMI, and time of year: Retrospective, longitudinal cohort study of 92,457 adults. PLoS One. 2020 Feb 5;15(2):e0227709. doi: 10.1371/journal.pone.0227709. PMID: 32023264; PMCID: PMC7001906.
- R. M. Baevsky, Methodical recommendations use kardivar system for determination of the stress level and estimation of the body adaptability standards of measurements and physiological interpretation, 2008. https://www.semanticscholar.org/paper/Methodical-recommendations-USE-KARDiVAR-SYSTEM-FOR/74a292bfafca4fdf1149d557348800fcc1b0f33b
- Nunan D, Sandercock GR, Brodie DA. A quantitative systematic review of normal values for short-term heart rate variability in healthy adults. Pacing Clin Electrophysiol. 2010 Nov;33(11):1407-17. doi: 10.1111/j.1540-8159.2010.02841.x. PMID: 20663071.
- Quintana, D., Alvares, G. & Heathers, J. Guidelines for Reporting Articles on Psychiatry and Heart rate variability (GRAPH): recommendations to advance research communication. Transl Psychiatry 6, e803 (2016). https://doi.org/10.1038/tp.2016.73