Introduction
Oura ring provides the nightly temperature deviation, derived from finger temperature sensor. Accuracy is questionable: can we rely on that metric?
Body core temperature can be measured in several ways, most of them is not a core temperature but just a proxy to it. Rectal temperature seems to be closest to core temperature, mouth temperature is not far from it, armpit, lobe and ear temperature are less reliable. Since mouth temperature is a good proxy to core, the oral thermometer was chosen.
Eric Jain project log pointed me to try Kinsa QuickCare thermometer.
The purpose of this self experiment (n=1) is to find how well Oura ring temperature deviation agrees with oral temperature measured by digital Kinsa QuickCare thermometer.
Materials & Methods
Participants
Adult male (n=1) anthropometrics was described in previous article
Experimental design
During 103 days from 2021-05-12 to 2021-08-28 morning oral temperature was assessed within 15 minutes after waking up. Thermometer were put under the tongue with closed mouth. After the thermometer voice signal data were syncronized into Kinsa App and then exported as text file.
Oura ring was weared on the left ring finger. Data for each night were exported into json text file and temperature_delta with bedtime_end was used in analysis.
Subjective sleep quality, mood, depression, anxiety, stress, fatigue and sleepiness was assessed by a popular in scientific research questionnaires described in previous experiment
Subjective sickness score was assessed by using 1-item 7-point Likert scale (0-6) every morning and evening:
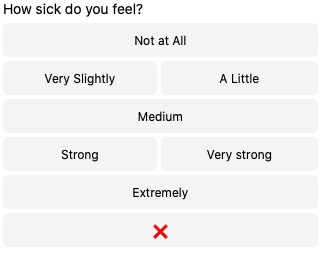
After assessment sickness status was defined as True if sickness score > 2, and False if sickness score <= 2.
Data and statistical analysis
RStudio v.1.3.959 was user for ANOVA, simple linear regression model was build to calculate slope and p-value. Pearson's correlation coefficient, p-value and confidence intervals were also calculated. Code is provided in Data section.
Results
Visual inspection supports the idea of consistency between both devices:
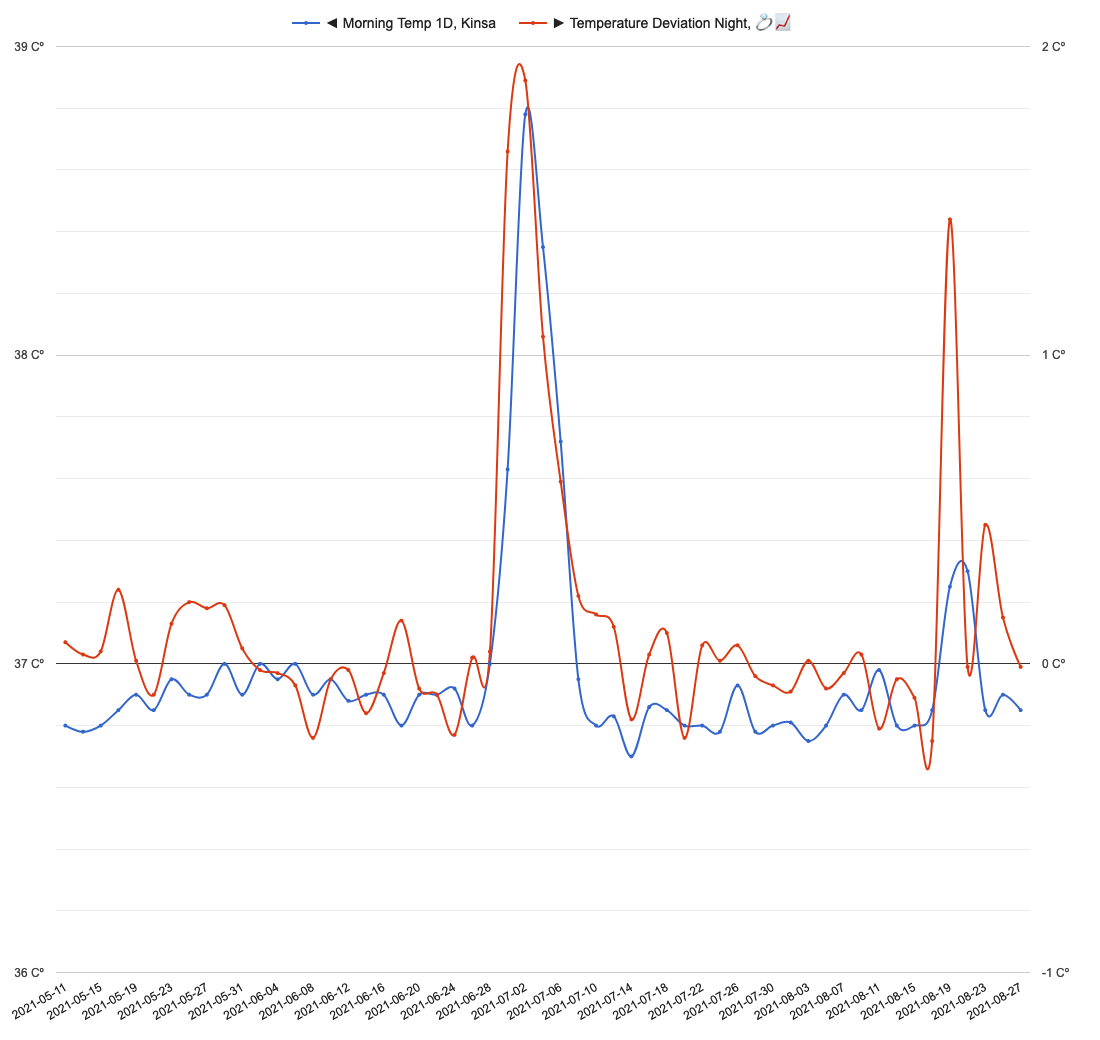 At 2021-06-29 participant got COVID-19 infection and acute rise in body temperature was reflected by both devices. At 2021-08-19 participant sick again with common cold.
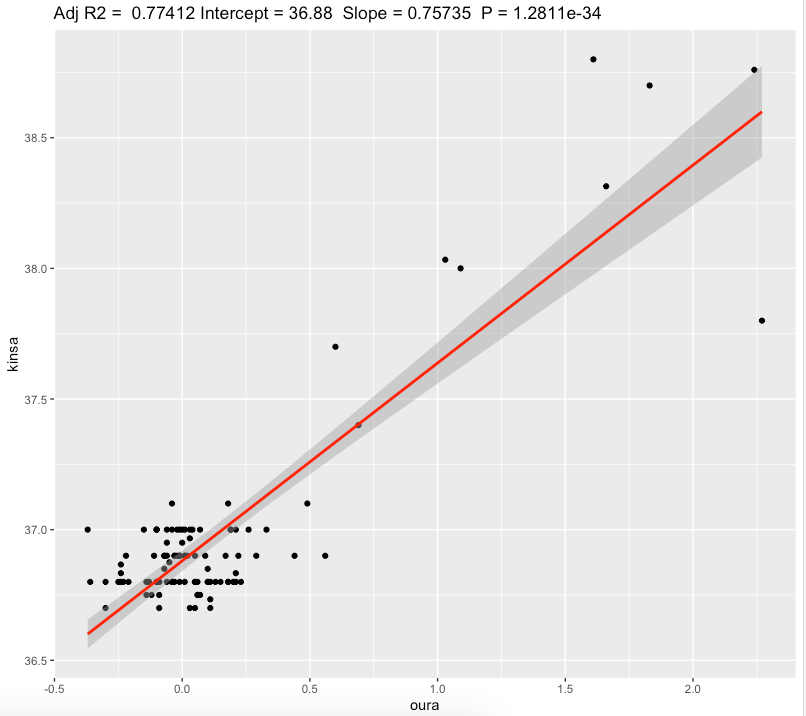
Linear regression also confirms consistency
| effect | p-value | effect size | |
| Oura, ℃ | 0.76 | <0.0001* | substantial |
We can see a slope of 0.76℃ and substantial effect size. For each 0.76℃ increase in oura temperature deviation we get 1℃ increase in oral temperature.
Pearsons correlation
| r | 95% CI | p-value | effect size | |
| Oura, ℃ | 0.881 | [0.83, 0.92] | <0.0001* | large |
Correlation analysis confirms strong relationship.
Since participant wore Oura ring for a 9 months, its worth to investigate all sickness events and check if they were detected by the ring.
Subjective sickness status (True is 1):
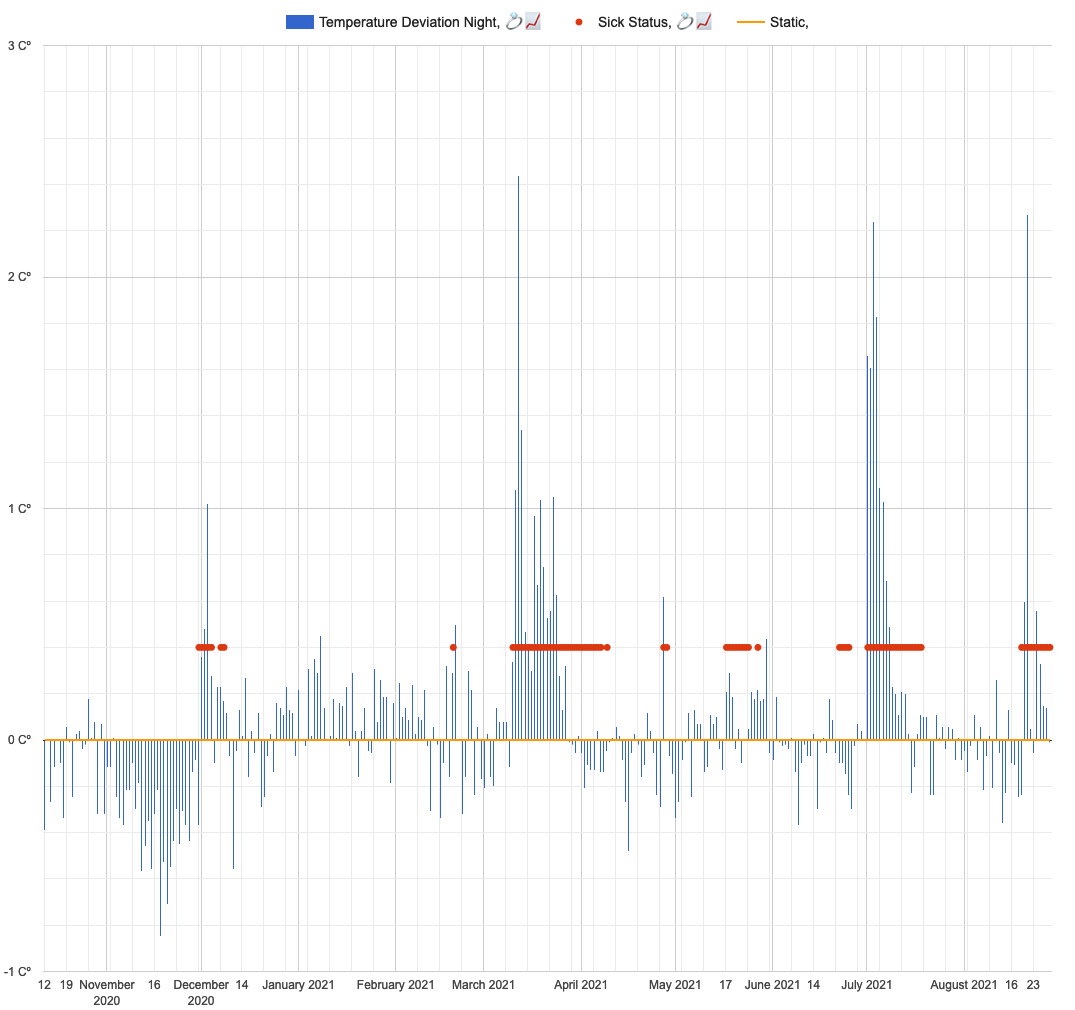
Visual inspection confirms good agreement between Oura ring temperature (blue bars) and subjective sickness status (red points).
Discussion
The main result of this experiment is a statistically significant correlation between Oura ring temperature deviation and morning oral temperature measured by Kinsa QuickCare with a large effect size.
In conclusion, Oura ring temperature seems to be accurate and reliable proxy to core body temperature and sensitive to body temperature spikes caused by sickness.
Not all diseases cause raise in body temperature meaning that Oura ring ability to detect sickness is limited. Also it can't help with circadian rhythm detection and it is unknown accuracy for infradian rhythm, with exception to female menstrual cycle and may be pregnancy
Limitations:
- These results are NOT generalizable
- Absence of blinding, randomization, observational nature, n=1
- Often correlation ≠ causation
- Questionnaires widely used in research are prone to participant bias.
Data availability & Information
Welcome for questions, suggestions and critics in comments below.
Data is fully available for oura and kinsa (raw)
R Code:
library(dplyr)
library(lubridate)
library(effectsize)
library(jsonlite)

rawoura<-fromJSON('https://blog.kto.to/uploads/oura_2021-08-28T04-51-48.json')
sleep<-flatten(data.frame(rawoura$sleep))
ouratemp<-sleep %>%
  select(bedtime_end,temperature_delta)
ouratemp$bedtime_end <- as.Date(ouratemp$bedtime_end);

kinsa <- read.csv("https://blog.kto.to/uploads/kinsa.csv")
kinsa$datetime <- as.Date(kinsa$datetime);

temps = list();
for(i in 1:nrow(kinsa))
{
  d1 =
  for(j in 1:nrow(ouratemp))
  {
    if(as.Date(kinsa$datetime[i]) == as.Date(ouratemp$bedtime_end[j]))
    {
      temps$kinsa[i] = kinsa$kinsatemp[i];
      temps$oura[i] = ouratemp$temperature_delta[j];
      temps$date[i] = kinsa$datetime[i];
    }
  }
}

l <- lm(kinsa ~ oura, data=temps)
summary(temps)
summary(anova(l))
s <- summary(l); s
interpret_r2(s$adj.r.squared[1])
confint(l , level = 0.05)

ggplotRegression(l)

c <- cor.test(temps$oura, temps$kinsa); c
interpret_r(c$estimate[[1]][1], "cohen1988")
Call:
lm(formula = kinsa ~ oura, data = temps)

Residuals:
     Min       1Q   Median       3Q      Max
-0.79967 -0.12214  0.00436  0.10583  0.70018

Coefficients:
            Estimate Std. Error t value Pr(>|t|)
(Intercept) 36.88049    0.01978 1864.22   <2e-16 ***
oura         0.75735    0.04045   18.72   <2e-16 ***
---
Signif. codes:  0 ‘***’ 0.001 ‘**’ 0.01 ‘*’ 0.05 ‘.’ 0.1 ‘ ’ 1

Residual standard error: 0.1928 on 101 degrees of freedom
Multiple R-squared:  0.7763,    Adjusted R-squared:  0.7741
F-statistic: 350.6 on 1 and 101 DF,  p-value: < 2.2e-16

> interpret_r2(s$adj.r.squared[1])
[1] "substantial"
(Rules: cohen1988)
> confint(l , level = 0.05)
                47.5 %     52.5 %
(Intercept) 36.8792454 36.8817326
oura         0.7548047  0.7598903
c <- cor.test(temps$oura, temps$kinsa); c

    Pearson's product-moment correlation

data:  temps$oura and temps$kinsa
t = 18.723, df = 101, p-value < 2.2e-16
alternative hypothesis: true correlation is not equal to 0
95 percent confidence interval:
 0.8289128 0.9180763
sample estimates:
      cor
0.8810963

> interpret_r(c$estimate[[1]][1], "cohen1988")
[1] "large"
(Rules: cohen1988)
Statistical analysis
RStudio version 1.3.959 and R version 4.0.2 was user for a simple linear regression model and to calculate slopes and p-values.
Effect sizes based on adjusted R2, Cohen's 1988 rules. Same for Pearson's correlation.