Measuring sleep is a complex task and the most accurate way of assessing it - getting good quality EEG signal and then use it to derive some sleep metrics (sleep stages, slow-wave amplitude etc). Additional signals (HR,HRV, Accelerometer etc) should be used to complement EEG and improve sleep staging accuracy.
Devices & Apps
Right now i have only 2 EEG devices. 3rd one is coming (OpenBCI).
- i've used Dreem 2 for about 1.5 years and have hundreds of nights. But Dreem 2 does not gives raw EEG signals and provides only final hypnogram and some other signals like HR or movements. That's solid and pretty casual, everything is popping up automatically in Dreem App and easily exported into csv from a few clicks in app. Another thing is a Deep Sleep Stimulations feature which seems to positively affect my Deep sleep. Pretty solid device with acceptable comfort threshold. Device costs around $400 at ebay, i have 3 of them. For long term use they might need to be fortified.
- Recently i've bought a Hypnodyne ZMax. It provides 2-channel high-quality raw EEG data at 256Hz. Accelerometer, PPG, Temperature, Noise and Light sensors complement EEG data and allow precise sleep staging. Data can be captured in offline mode to sd card or wireless streaming to pc and receiving usb dongle and read-to-use windows server and analysis software. Data is stored in EDF which is widely supported. Some real-time scripting and stimulations available to self-code, device can play audio and turn LEDs. Device is more comfortable then Dreem 2 and seems as ideal quality / comfort trade off. I'm also using it for neurofeedback with BrainBay (it connects to neuroserver). Price was around $4000.
- Soon, i will get OpenBCI Cyton 8-ch board with 256Hz per channel. I plan to sleep with it for a few nights and use it compare with ZMax and add ECG/EMG channels to neurofeedback to complement ZMax EEG inputs. (I want full party of ECG+EMG+EEG inputs into Brainbay).
Raw data cooking
Since only ZMax gives me raw data i will describe my approach with it. There are set of teaching videos on youtube how to score sleep from raw data. I went through my nights and scored them manually which was interesting to get a deep understanding on my sleep patterns. Here is an example night which i've scored manually (not perfect for sure, i'm not sleep specialist):
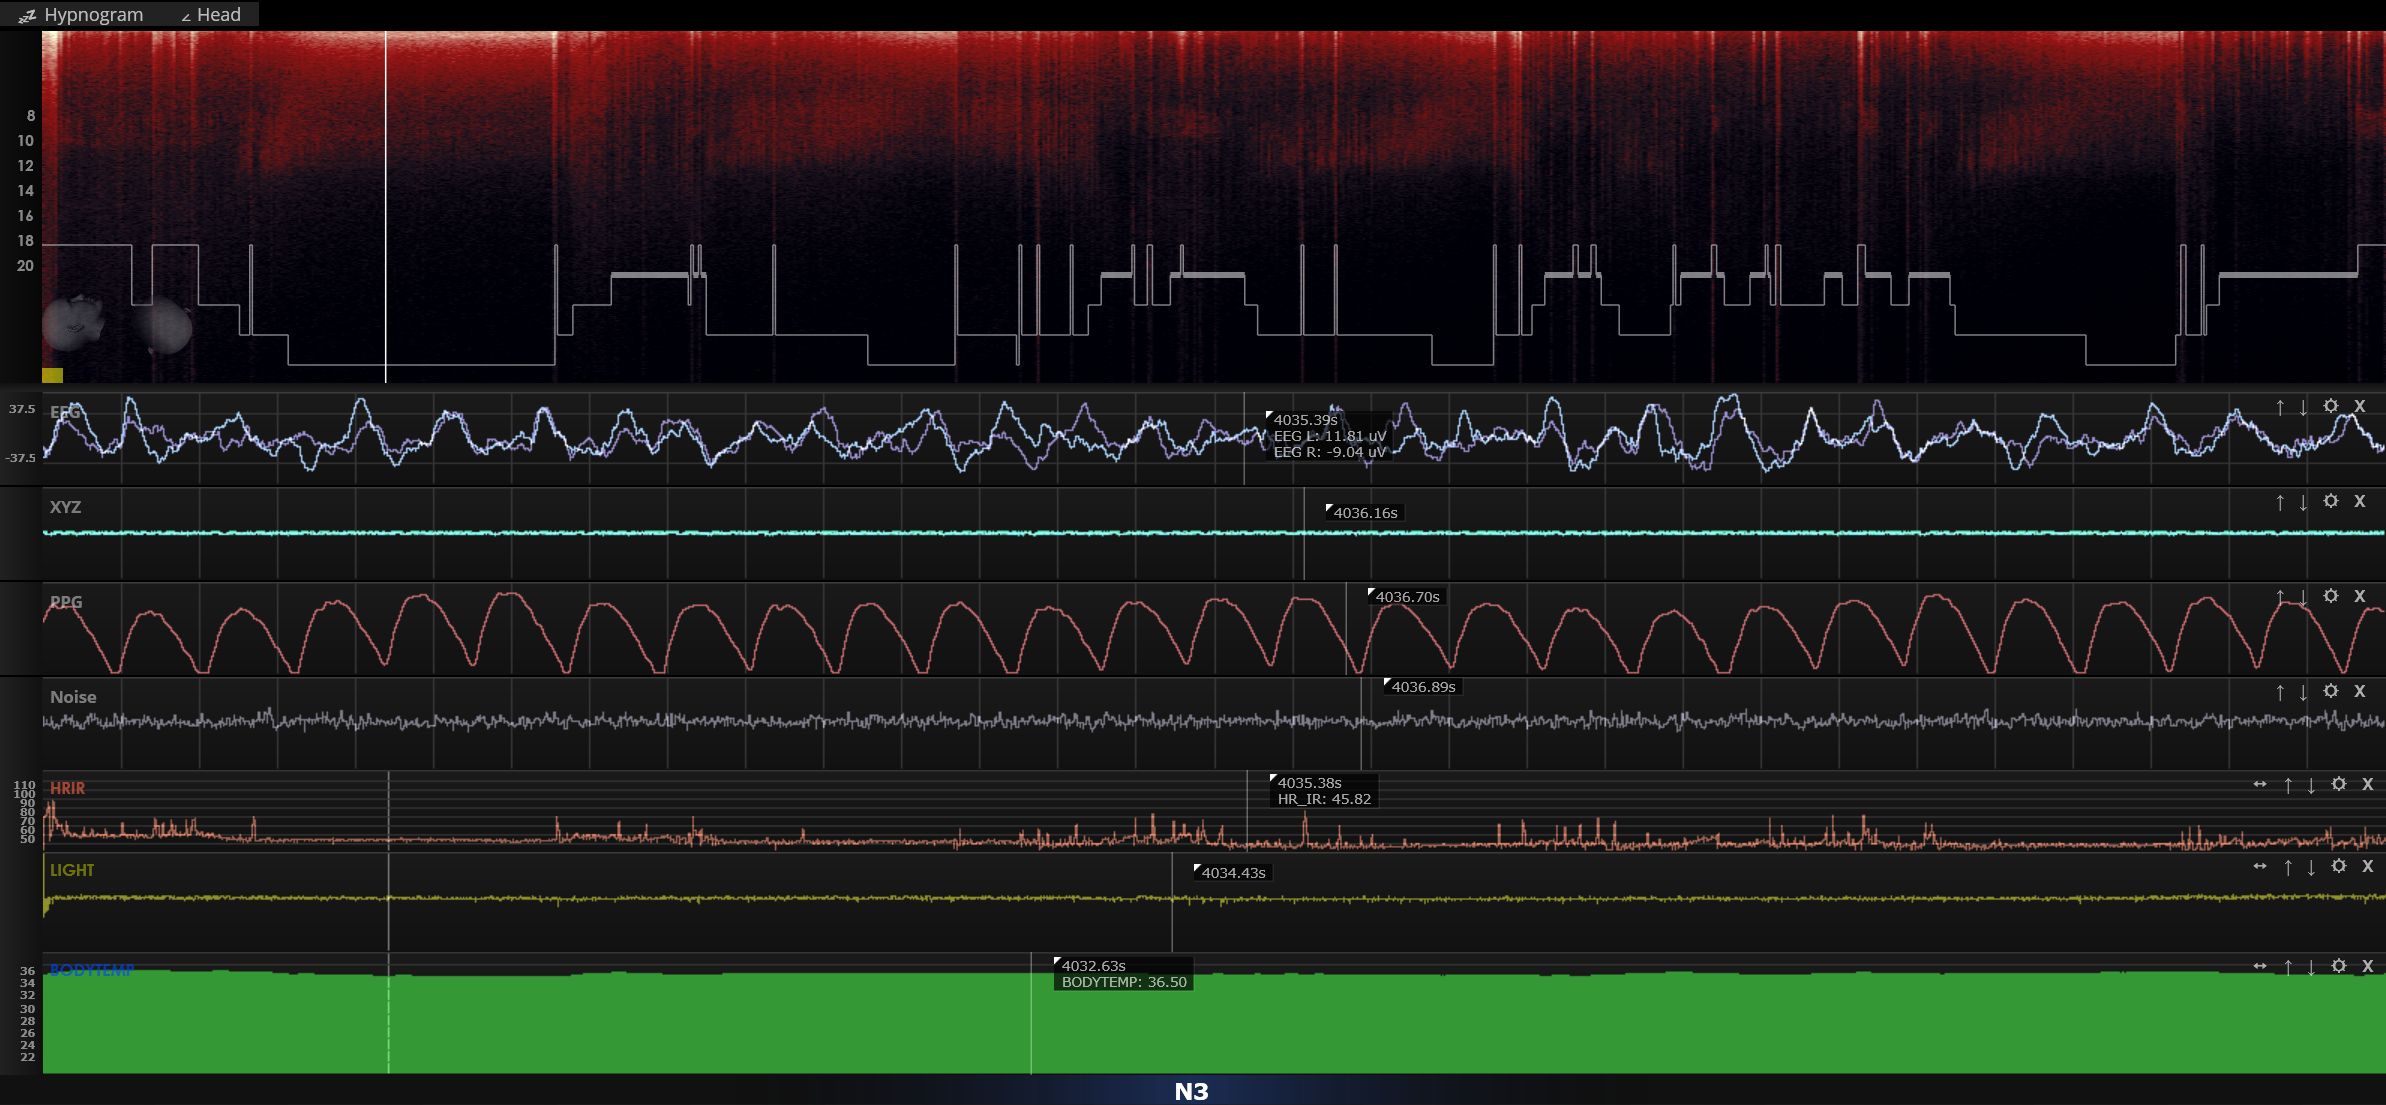
Here we can see raw EEG from both channels, XYZ accelerometer data, PPG, Noise, HR, Light and Body Temp. Scoring manually each night might be useful for understanding personal sleep patterns but seems to be impractical for long-term day-to-day usage. So i need automatic sleep scoring (like Dreem does) but the manufacturer's automatic sleep scoring is under paywall for $15 each night.
In that situation i've decided to use open-source library for sleep scoring made in Matthew Walker lab and published on github. This model was trained on PSG data and seems to have acceptable accuracy of ~85% compared to consensus of 5 sleep experts. Remember, 5 sleep experts have same ~85% agreement between themselves, so model seems to perform in sleep specialist subjectivity range.
I'm using RStudio with reticulate to use YASA for sleep scoring. There are few considerations which needs to be taken into account:
- YASA utilizes single channel EEG for sleep scoring. The good news that it provides not only predicted stage, but also probability of each stage at that 30-sec epoch.
- For each EEG channel hypnogram being built and probabilities for each stage are being summed and stage with max probability from both channels are being chosen as final. Also confusion matrix were built and plotted for each channel to check how good channels agree between themselves.
- Assessing SWS Amplitude supports multiple EEG channels
That's all i need for now. Lets see how to get this with RStudio + Python, only edf files with EEG are needed. This can be applied to any device, not only ZMax. I will use same approach for OpenBCI when i get it.
Some Python functions here to get 2 channels EEG load, get hypnogram and probabilities for channel and get SWS amplitudes:
def get_raws(files):
raw = mne.io.read_raw_edf(files[0], preload=True, verbose=False)
raw2 = mne.io.read_raw_edf(files[1], preload=True, verbose=False)
raw.add_channels([raw2])
raw.filter(0.1, 40)
return raw
def get_raws(files):
raw = mne.io.read_raw_edf(files[0], preload=True, verbose=False)
raw2 = mne.io.read_raw_edf(files[1], preload=True, verbose=False)
raw.add_channels([raw2])
raw.filter(0.1, 40)
return raw
def get_sleep_hypno(files, male, age, channel):
raw = get_raws(files)
# Select a subset of EEG channels
raw.pick_channels([channel])
sls = yasa.SleepStaging(raw, eeg_name=channel, metadata=dict(age=age, male=male))
y_pred = sls.predict()
return y_pred
def get_sleep_hypno_probs(files, male, age, channel):
raw = get_raws(files)
# Select a subset of EEG channels
raw.pick_channels([channel])
sls = yasa.SleepStaging(raw, eeg_name=channel, metadata=dict(age=age, male=male))
y_proba = sls.predict_proba()
return y_proba
def get_sws_amplitude(files, hypno):
raw = get_raws(files)
hypno = yasa.hypno_upsample_to_data(hypno, sf_hypno=1/30, data=raw)
sw = yasa.sw_detect(raw, ch_names=raw.ch_names, hypno = hypno, include=(2, 3))
summ = sw.summary(grp_chan=True, grp_stage=False, aggfunc='mean')
return summ
And then some R code to get things done:
file.ch <- c(file.name, file.name2)
psg1 <- get_sleep_hypno(file.ch, T, age, channel)
psg1.probs <- get_sleep_hypno_probs(file.ch, T, age, channel)
psg2 <- get_sleep_hypno(file.ch, T, age, channel2)
psg2.probs <- get_sleep_hypno_probs(file.ch, T, age, channel2)
sws.amp = get_sws_amplitude(file.ch, hypno)
ptp <- weighted.mean(sws.amp$PTP, sws.amp$Count)
Here we got stages with probabilities for both channels and SWS amplitude. YASA also allows us to calculate spectrogram and do some cool plots (you may check them in github). That's all for now with code, lets look at some plots:
Here is agreement between 2 channels:
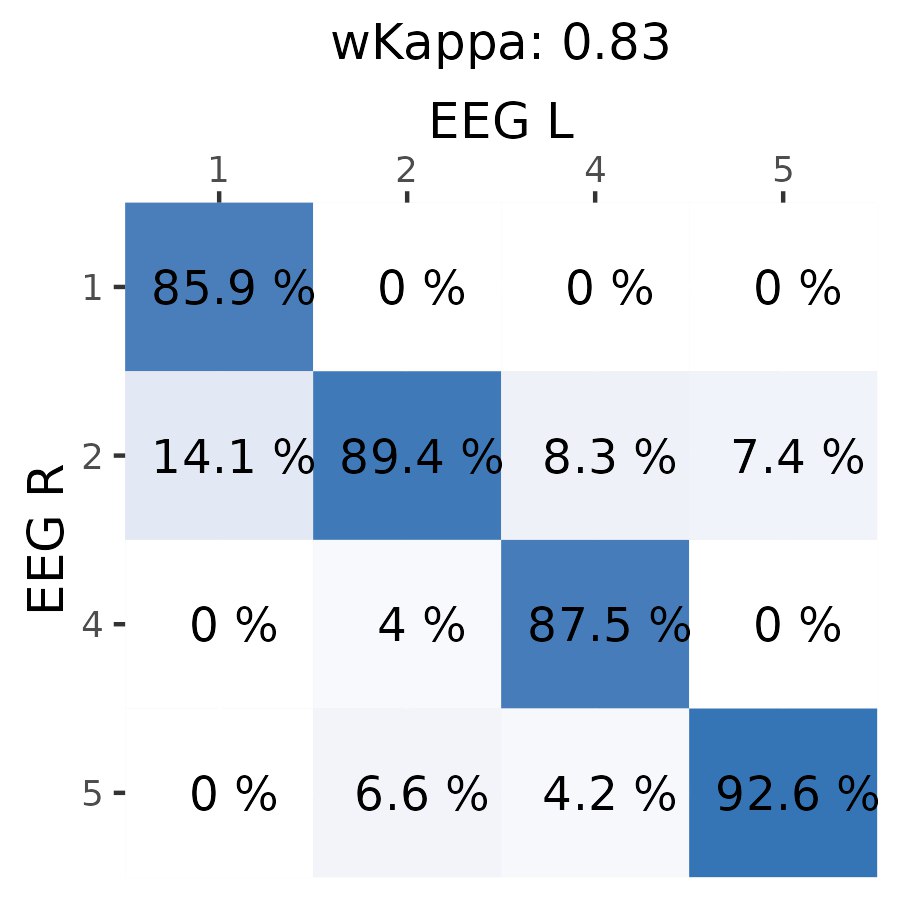
1 is a N3 (deep), 2 is N2+N1 (light), 4 is REM and 5 is Awake.
Agreement seems to be in acceptable range, since most of my sleep is on side there might be different pressure on electrodes vs pillow. Also F7 and F8 channels might have difference in signals due to be placed on different brain areas. Another thing is maybe sweat glands disturb signal at different timings for each side. Anyway it seems to be of good agreement on sleep stages (most of days i'm getting 85-95% agreement).
Lets build final hypnogram from YASA by choosing stage with biggest sum of probabilities.
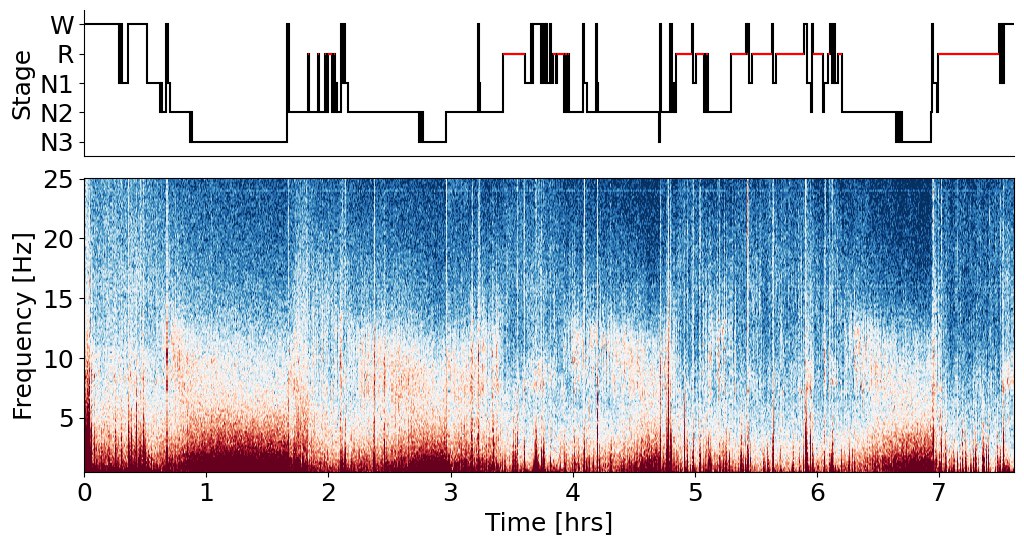
Looks like a real hypnogram here! Let's look closer at my manual scoring, which i did before implementing auto-scoring with YASA:

Top - manual scoring. Bottom - YASA scoring
Hmm. It seems we agree pretty well with YASA and i'm not sure who is better here :) In situation like that i will pass sleep scoring job to YASA since i dont see it being worse or better than my manual scoring.
Last thing to have a look is SWS Amplitude which may represent degree of sleep depth:
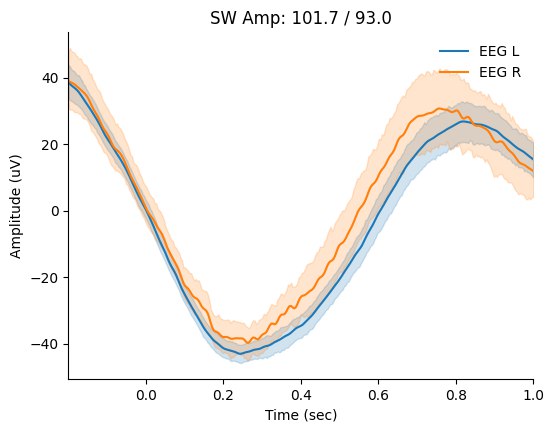
Not too much to learn from these values right now, but i can clearly see that there is more noise on right channel - so i would check the electrode placing. First of all, I would need to build some dataset to look for day-to-day trends and learn more about what SWS Amp represents and what insights it can provide.
Also R can help us with creating some handy plots with ggplot2:
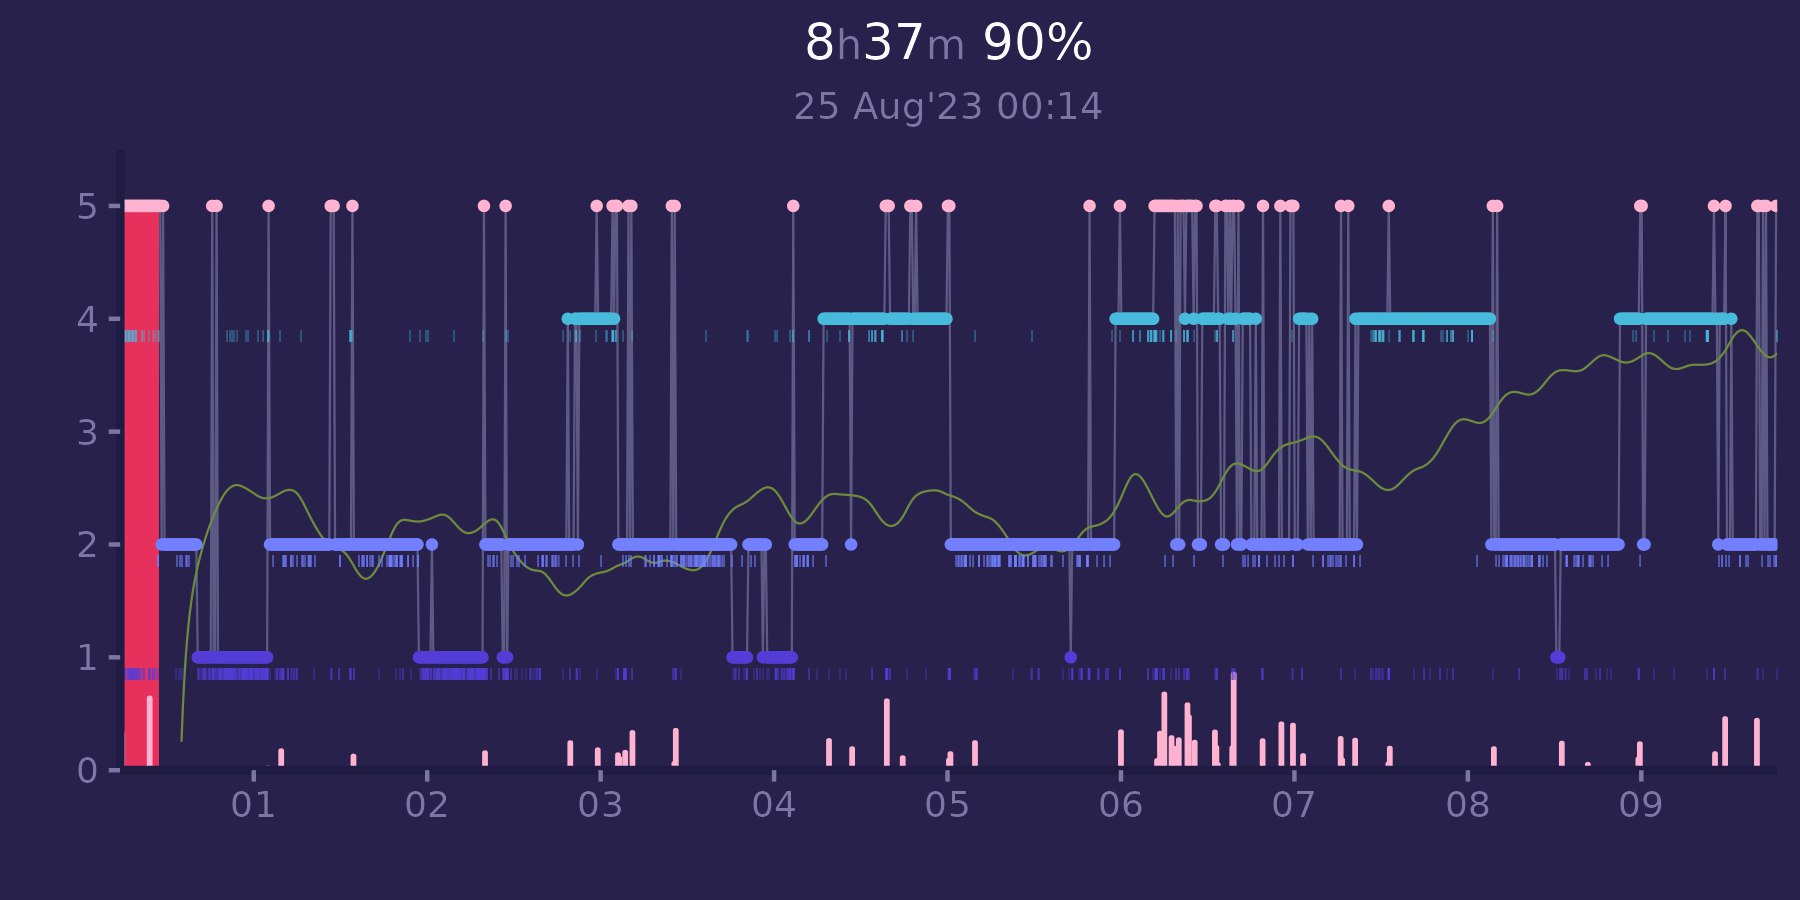
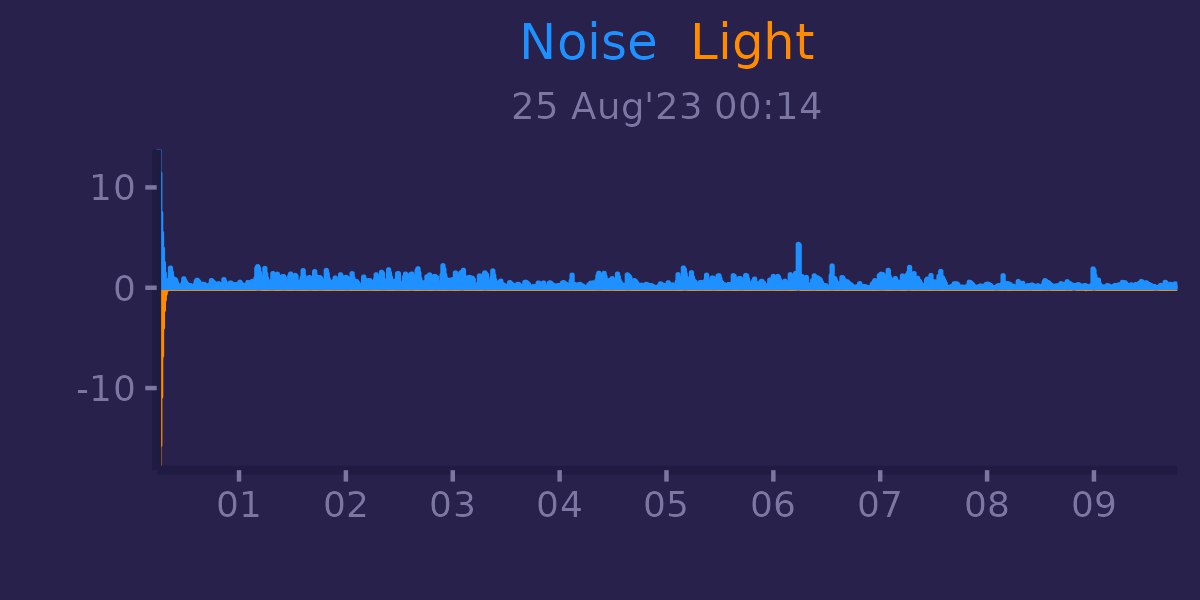
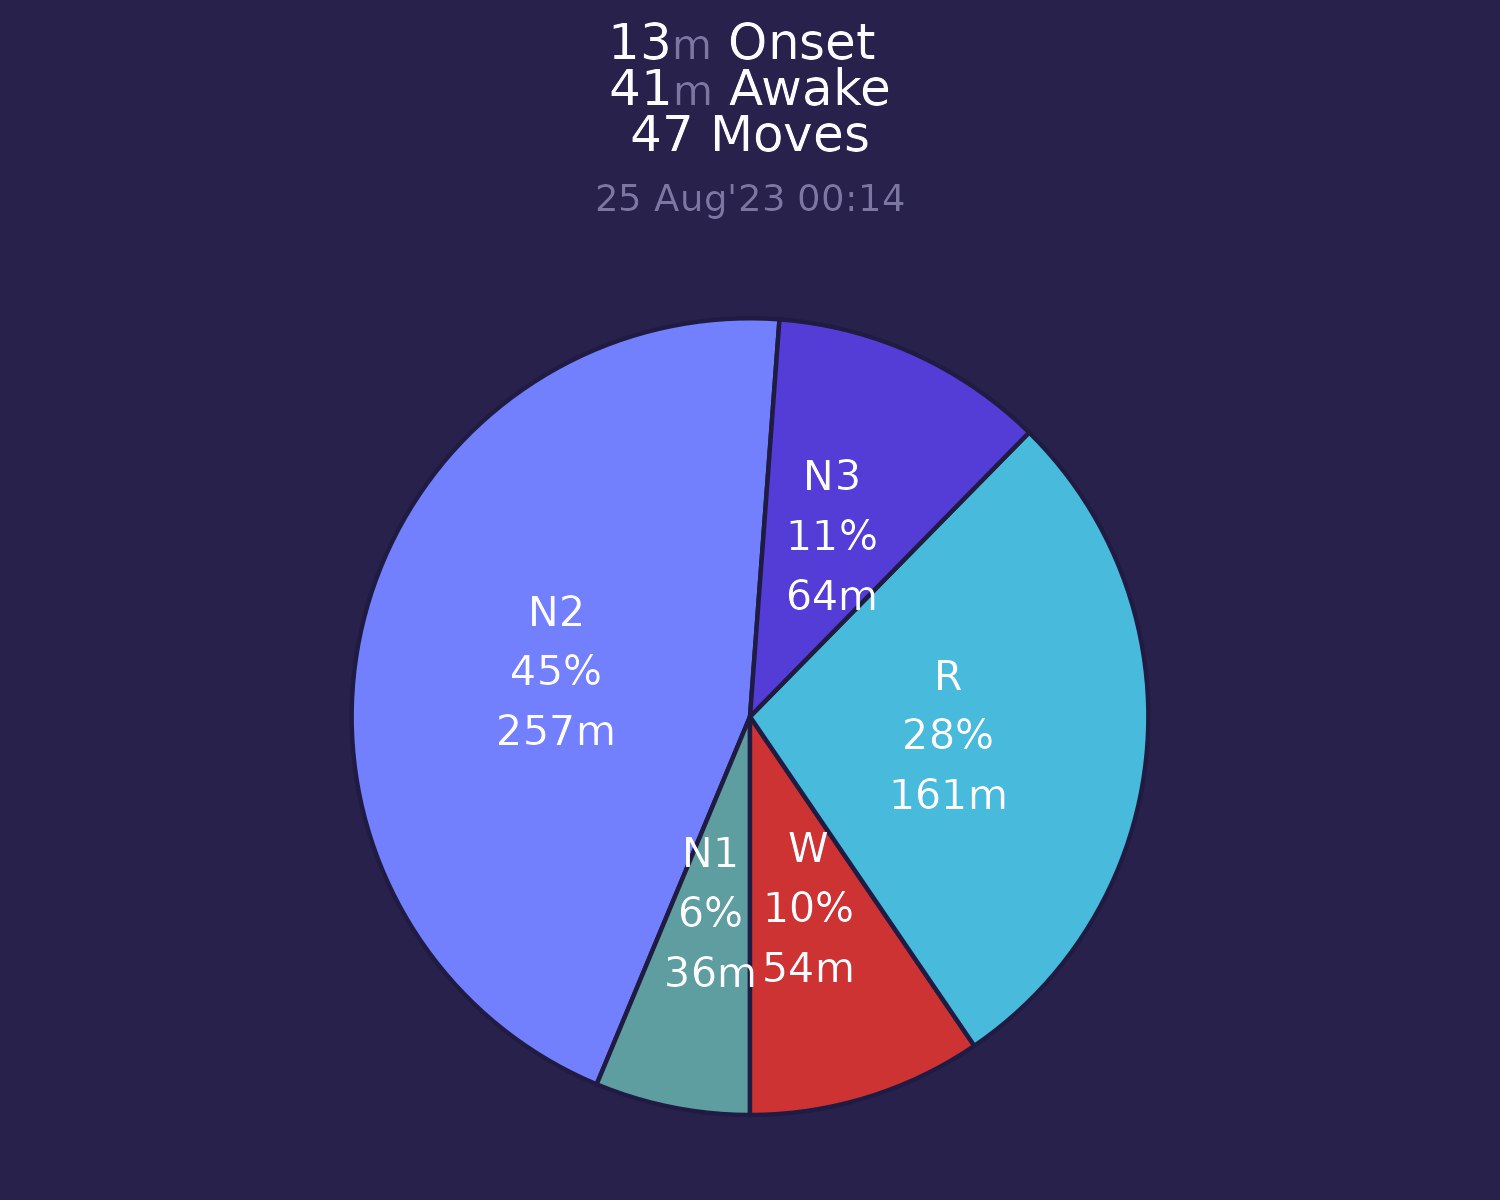
With post about ECG we get covered on 2 major signals.
In a future i will improve post. Feel free for comments and considerations.