Clustering techniques may provide interesting insights into patterns of our biomarkers. Here is simple example on clustering oura ring 2.0 sleep data.
Some of oura sleep data seems to be not accurate, so i'm focusing only on a few biomarkers: breathing rate, nightly HR and HRV, temperature deviation, time in bed. Analyzed dataset contains 667 nights.
Here i begin with 2 simple algorithmsfor clustering: K-means (KNN) clustering and Hierarchical clustering (HC). Both algorithms have different settings, but number of clusters and point distance method made a powerful influence on results. Knowledge about clustering i've got from this beatiful data analysis textbook (p. 516)
I've started with 3 clusters and pearson correlation as method for distance and got interesting results. Radar plot is intuitive way to visualize clusters if there is 3-8 variables of interest. The first run gave me interesting results:
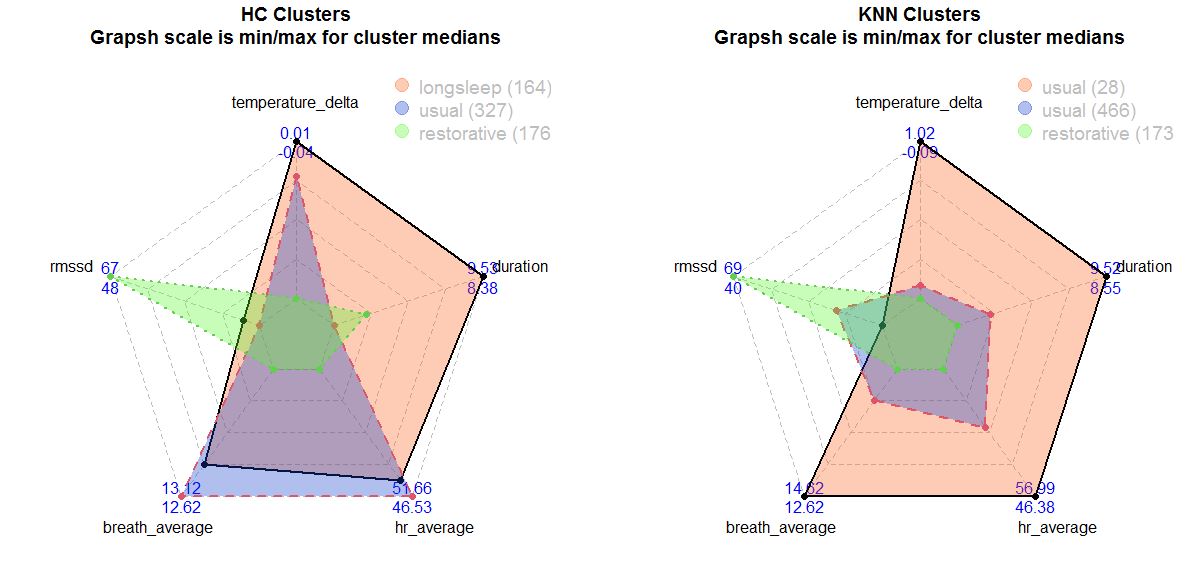
Left: Hierarchical clustering. Right: K-means clustering. Numbers are max (1st line) and min (2nd line)
Red and green clusters looks same for both HC and KNN:
- Red cluster for KNN have high breathing rate, high HR and low HRV, long sleep duration and temperature. It seems like a sick night!
- Green cluster have a totaly different picture - pretty high HRV, low HR and breathing rate and not too long sleep duration for both KNN and HC. This one looks like pretty nice night, where i'm in recovery mode.
- Violet KNN seems to be a usual night where all biometrics are in balance.
Looking at KNN results we can see a clear patters of sick night on one side and restorative night on other side and usual night beetween them. Running analysis with more clusters or euclidean distance method did not produce additional meaningful clusters, so i've finished with 3 clusters and correlation as distance.
As we identified 3 night patterns, lets describe them in numbers.
| Restorative (173) | Usual (466) | Sick (28 nights) | |
| HR, bpm | 46.4 [44.1,47.4] | 51.2 [49.9,52.8] | 57 [55.4,60] |
| HRV, ms | 69 [62,75] | 49 [45,53] | 40 [35,45] |
| temperature delta, C | -0.09 [-0.25,0.05] | 0 [-0.1,0.13] | 1.02 [0.63,1.41] |
| breathing rate, rpm | 12.6 [12.4,12.9] | 13.1 [12.9,13.4] | 14.6 [13.6,15.3] |
| time in bed, h | 8.5 [8.1,9] | 8.8 [8.2,9.4] | 9.5 [8.6,10.1] |
Data represented as median and IQR [q25,q75].
On the sick night my temperature raise by more than +0.63C, i sleep ~9.5 hours with high HR>55 and low HRV <45. Restorative night not differ from usual night on sleep duration (~8.5h) and temperature (<0.15C) and breathing rate (~12.9). The main difference in restorative night compared to usual night is high HRV (+25ms) and lower HR (-5 bmp).
These results may seen as obvious, but i think it's always a good idea to move from subjective feelings of a good night to objective measurements and classification. Also these results provide objective thresholds which can help categorise 5 different measures into 3 simple categories: restorative, usual and sick.
These results should not be generalized and might be person-specific. Soon i'm going to analyse my sleep stages patterns by using Dreem 2 EEG data.
Data availability & Information
Welcome for questions, suggestions and critics in comments below.
Original unmodified (exported) oura raw data for oura is here.
R Code is available at Github (raw data download make take a while, file is ~10MB)
Statistical analysis
RStudio version 2022.07.1 and R version 4.2.1.